Thinking Ahead InstituteGlobalPension Assets Study|2025
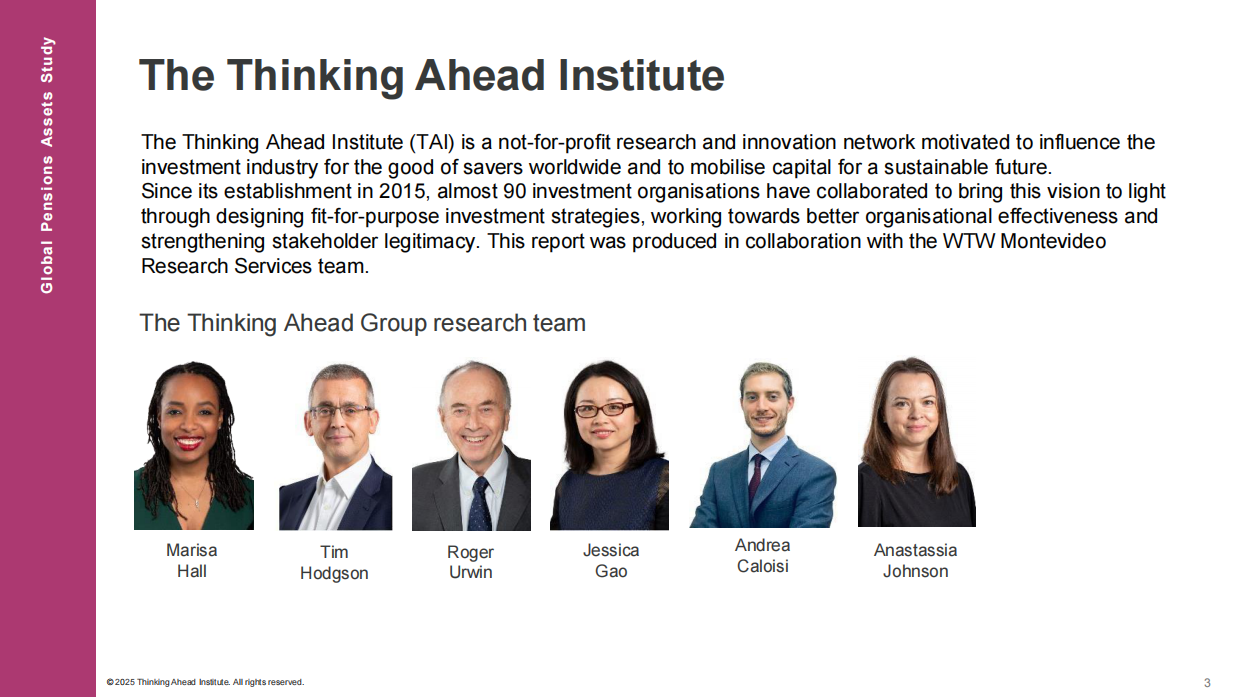
Apniss1essy suolsued1e9o13The Thinkinq Ahead InstituteThe Thinking Ahead Institute (TA) is a not-for-profit research and innovation network motivated to influence theinvestment industry for the good of savers worldwide and to mobilise capital for a sustainable futureSince its establishment in 2015, almost 90 investment organisations have collaborated to bring this vision to lightthrough designing ft-for-purpose investment strategies, working towards better organisational effectiveness andstrengthening stakeholder legitimacy. This report was produced in collaboration with the WTW MontevidedThe Thinkina Ahead Group research teamMarisaTimRogerJessicaAndreaAnastassiaHallHodasonUrwinGaoCaloisiJohnson
TAIGlobalPensionsAssetsStudyExecutive summaryOverviewandkevfindings02025ThakingAhedistiue.Alightsrese
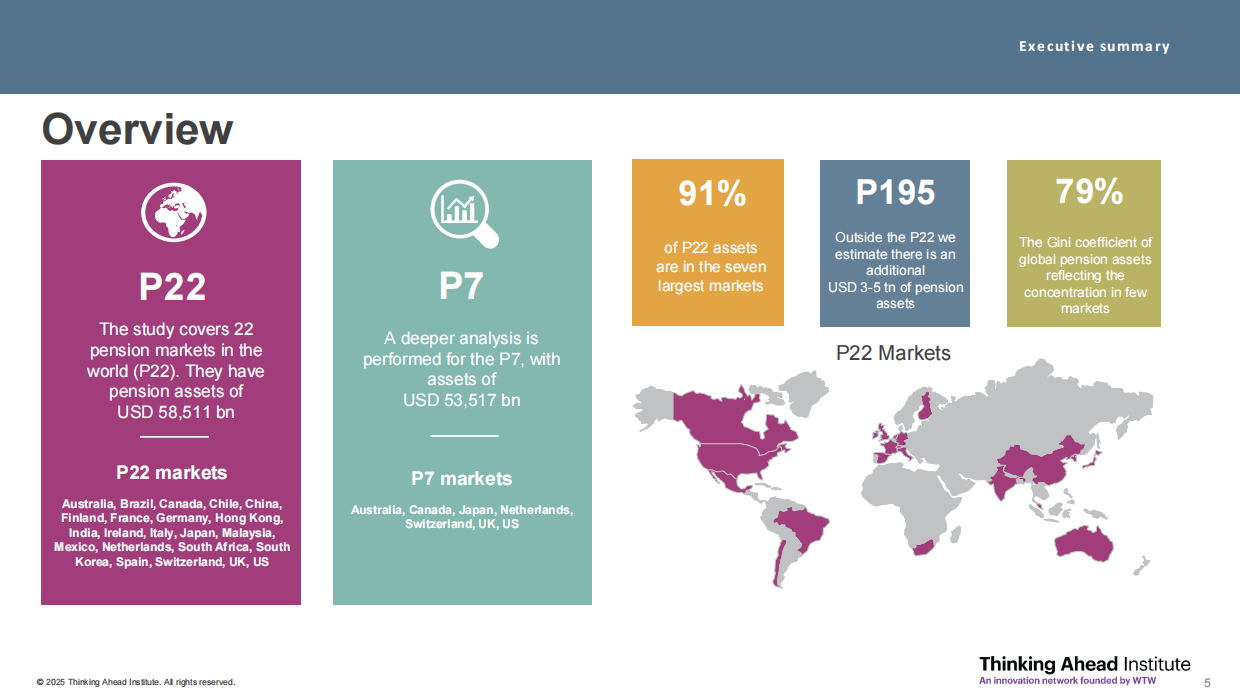
Executive summaryOverview91%P19579%mMOutsidetheP22weTheGinicoefficientofof P22 assetsestimatethereisanglobalpensionasare inthe sevenadditionalP22P7USD3-5tnofpensionreflectingthelargestmarketsassetsmarketsThestudycovers22A deeperanalysis ispension markets in theperformedfortheP7, withP22 Marketsworld (P22). Theyhaveassetsofpension assets ofUSD53,517bnUSD58,511bnP22 marketsP7marketsAustrala, Canada,Japan,Netheriands,Switzerland, UK,USMexico.NetheriaKorea,Spain,SwitzorlandUK,UsThinkinaAheadInstituteAninovationnetworkfoundodbyWTW
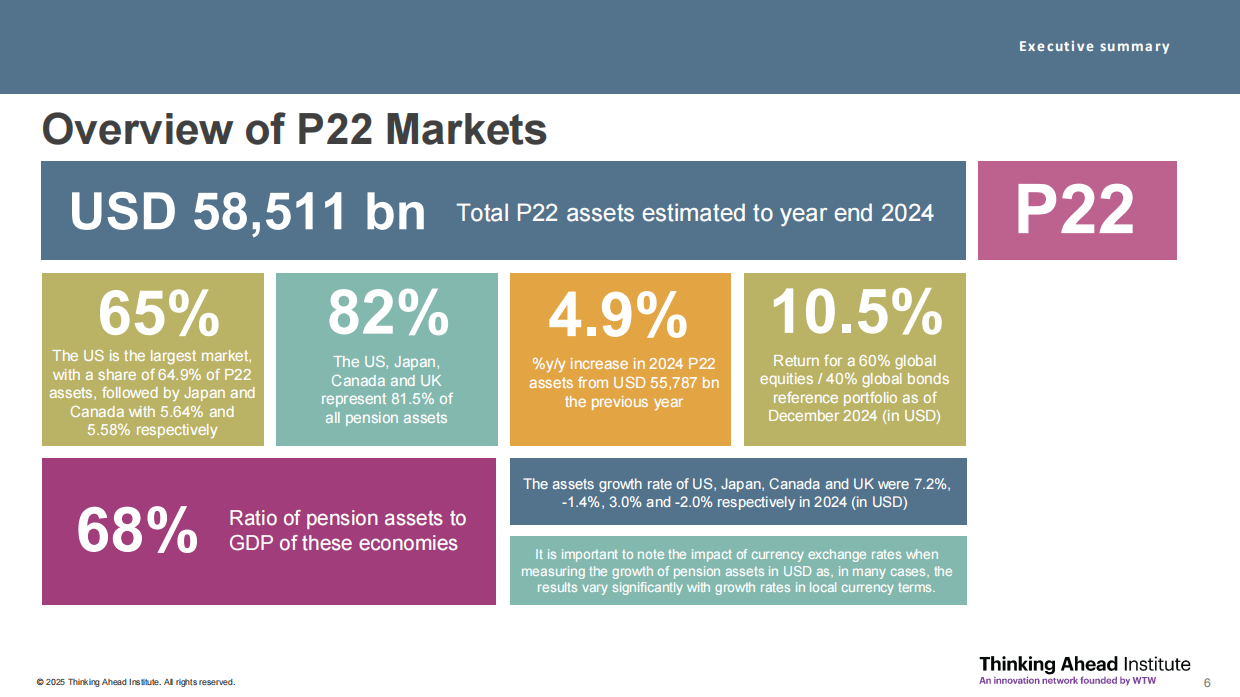
Executive summaryOverview of P22 MarketsUSD58,511 bnP22Total P22 assets estimated to year end 202465%82%4.9%10.5%TheUS is thelargestmarket,TheUS,Japan,%ylyincreasein2024P22Retumfora60%globalwithashareof64.9%ofP22CanadaandUKassetsfromUSD55,787bnequities/40%globalbondsassets, followedbyJapanandrepresent81.5%ofthe previous yearreferenceportfolio as ofCanadawith5.64%andall pensionassetsDecember2024(inUSD)5.58%respectivelyThe assets growth rate ofUS, Japan, Canada andUKwere 7.2%,-1.4%.3.0% and-2.0% respectively in 2024 (in USD)68%Ratio ofpension assets toGDP of these economiesIt is important to note the mpact of curency exchange rates whenmeasuring the growth of pension assets in UiSD as Inmany cases theresuis varysgnlicantly wihngrowth rates i loca cunency termsThinkingAheadInstitute,Aninnovationnetworkfoundedby WTW
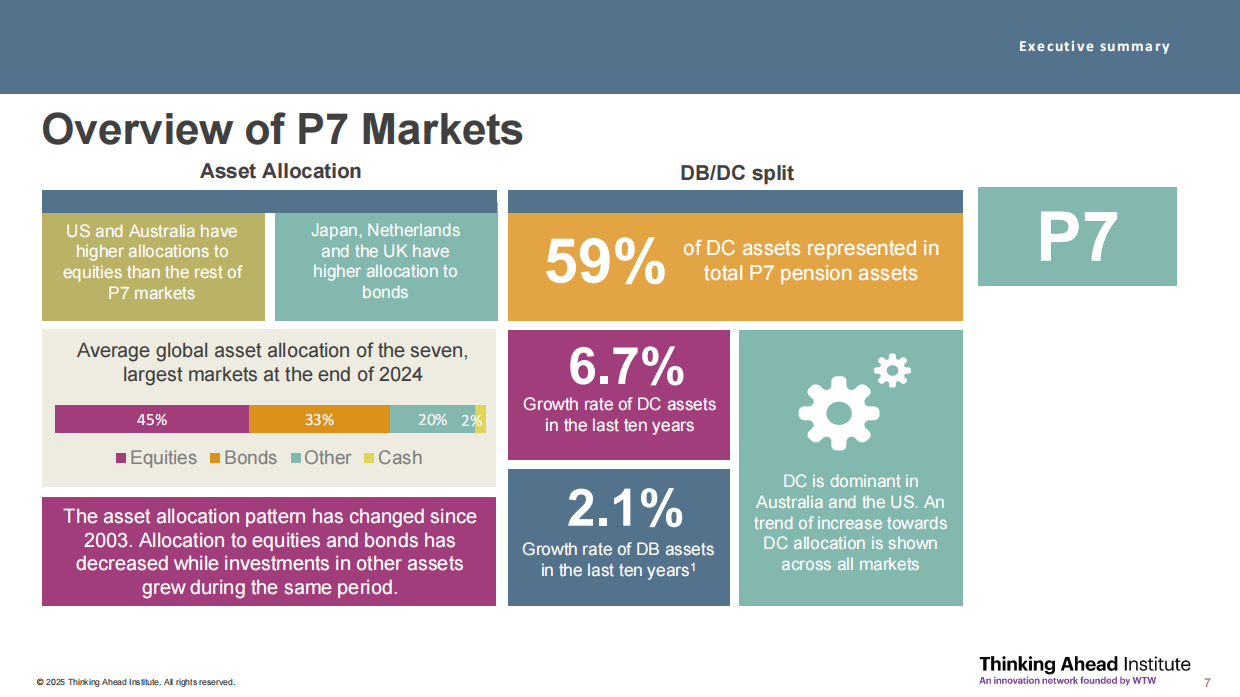
Executive summaryOverview of P7 MarketsAssetAllocationDB/DC split59%P7USandAustraliahaveJapan, Netherlandshigher allocations toand theUKhaveof DC assets represented inequities than the rest ofhigher allocation tototal P7 pension assetsP7marketsbonds6.7%Average global asset allocation of the seven,largest markets at the end of2024GrowthrateofDC assets45%20%2%in thelast tenyears33%mEquities = Bonds =Other=CashDC isdominantin2.1%AustraliaandtheUS.AnTheasset allocation patterm haschangedsince,trend ofincreasetowards2003.Allocationtoequities andbondshasDCallocationisshownGrowth rate of DB assetsdecreased while investments in other assetsin the last ten years1acrossallmarketsgrewduringthe sameperiodThinkingAheadInstitute,tworkfoundedbyWTW
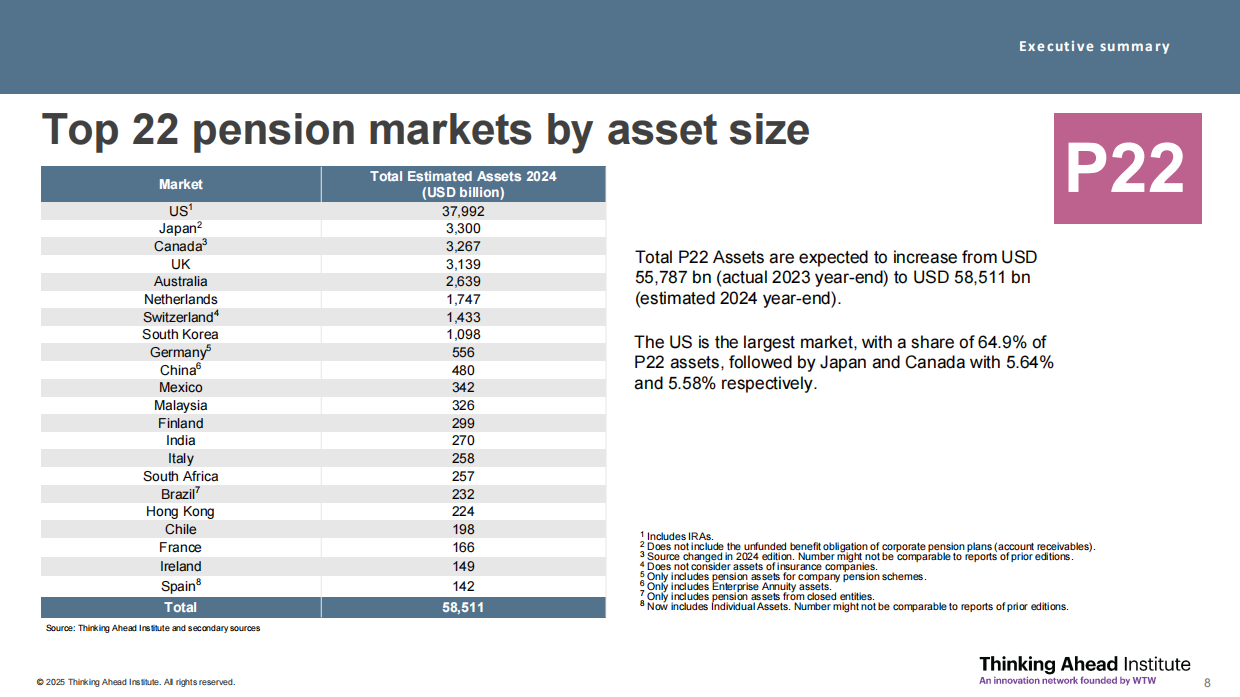
Top 22 pension marketsasset sizeOVP22TotalEstimatedAssets2024Market(USDbillion)JS37,992TotalP22Assetsareexpected to increase ...