Q.EYPrivateHow can you findthe clarity to steeryour growth?EYGlobal IPO Trends Q22022ey.com/ipoltrends #lPOreportEYThe betterthe question.Thebetterthe answerBuildingabetterThebettertheworldworksworking world
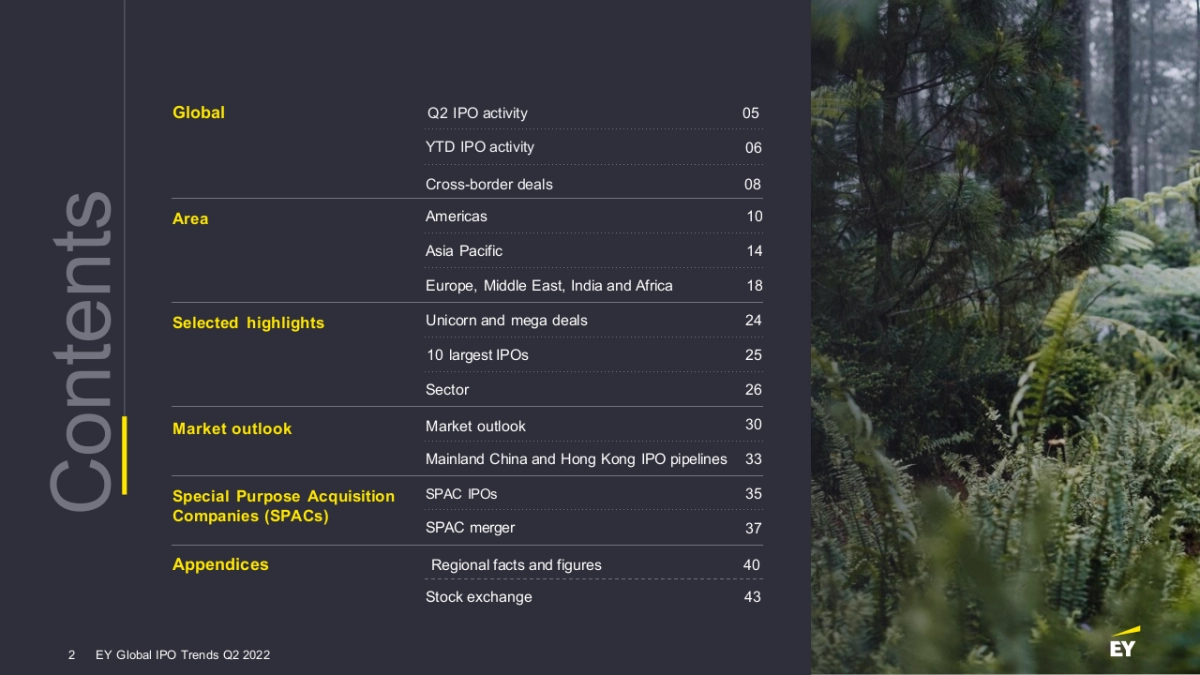
GlobalQ2IPOactivityYTDIPOactivityCross-borderdealssiueiuosAreaAmericas2AsiaPacifinEuropeMidle East,IndiaandAfricaSelectedhighlightsUnicornandmeaadeals10 largest IPOs2Sector2Market outlook0Market outlookMainlandChina andHangKongIPOpipelines,SpecialPurposeAcquisitionSPACIPOs55Companies(SPACs)SPACmergerRegionalfacts andfiguresStockexchange432EYGlobalPOTrendsQ22022EY
GlobaEYGlobalIPOTrends Q22
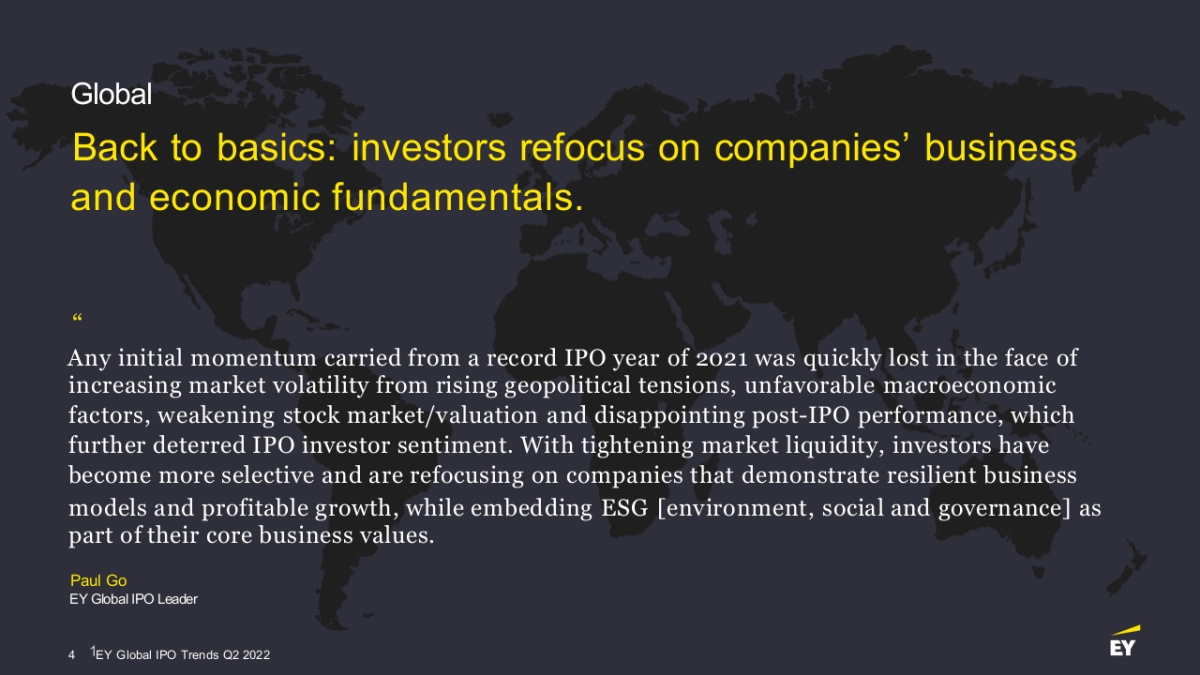
GlobalBack to basics: investors refocus on companies businessand economic tundamentalsAnv initia momentum carried from a record IPO year of 2021 was quickly lost in the face ofincreasing market volatility from rising geopolitical tensions, unfavorable macroeconomicfactors, weakening stock market/valuation and disappointing post-IPO performance, whichfurther deterred IPO investor sentiment. With tightening market liquidity, investors havebecomemoreselective and are refocusing on companies that demonstrate resilient businessmodels and profitable growth, while embeading ESG environment, social and governance aspart of their core business values.PaulGo1EYGlobalIPOTrendsQ220224
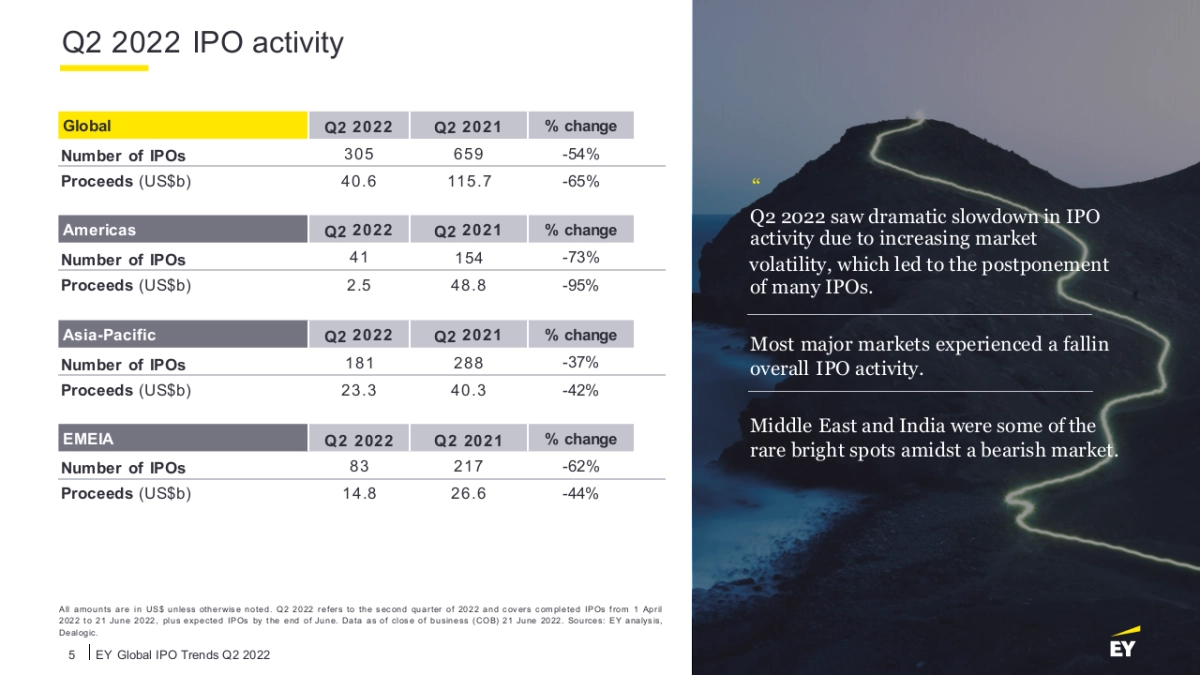
Q22022 IPO activityGlobalQ22022Q22021%changeNumber of IPOs305659-54%Proceeds(US$b)40.6115.7-65%Q22022sawdramaticslowdownin IPOAmericasQ22022Q22021%changeactivity due to increasing marketNumber of IPOs41154-73%volatility, which led to the postponementProceeds(US$b)2.548.8-95%of many IPOs.Asia-PacificQ22022Q22021%changeMost major markets experienced a fallin.NumberofIPOs18128837%overall IPO activity.Proceeds(US$b)23.340.342%Middle East and India were some oftheEMEIAQ22022Q22021%changerare bright spots amidst a bearish market.Number of IPOs83217-62%Proceeds(US$b)14.826.6-44%EY5|EYGlobalIPOTrendsQ22022
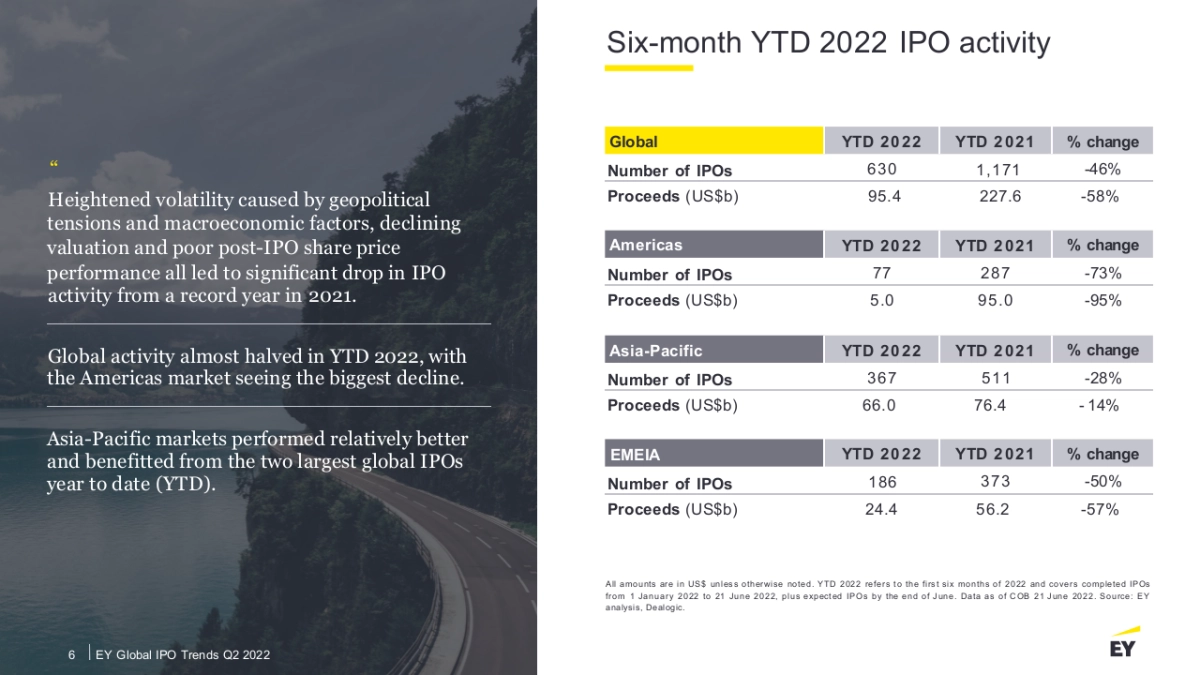
Six-month YTD2022 IPO activityGlobalYTD2022YTD2021%changeNumberofIPOs6301.17146%Heightened volatility caused bygeopalticalProceeds(US$b)95.4227.6-58%tensions and macroeconomic factors, decliningvaluation and poor post-IPO share priceAmericasYTD2022% changeYTD2021performancealedtosiginfieant dropin IPONumber of IPOs77-73%287Proceeds(US$b)5.095.0-95%Global activity almost halved in YTD 2022, withAsia-PacificYTD2022%changeYTD2021the Americas market seeing the biggest decline.Number of IPOs367511-28%Proceeds(US$b)66.076.4-14%Asia-Pacific markets performed relatively betterEMEIAYTD2022YTD2021%changeand benefitted from the twolargest global IPOsyear todate(YTD).Number of IPOs186373-50%Proceeds(US$b)24.456.2-57%EYIEYGlobalIPOTrendsQ22022
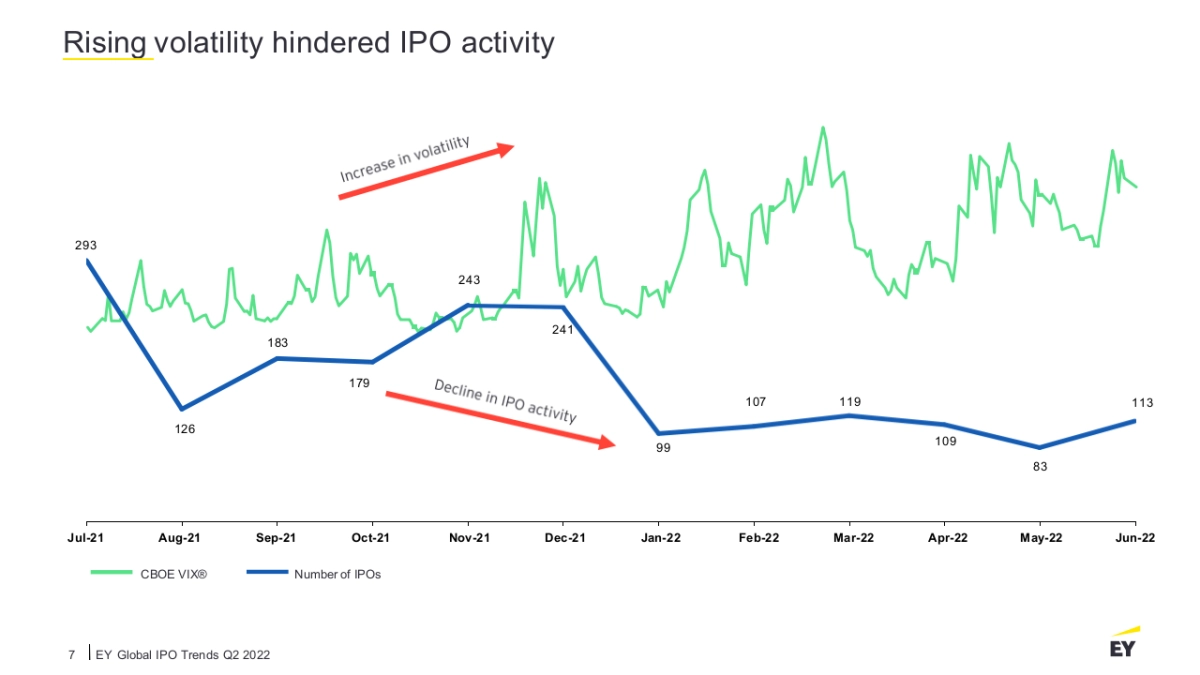
Risina volatility hindered IPO activityIncreaseinvolatilityDeclineinIPOactivity17910711910983Aug-21Sep-21Oct-21Nov-21Dec-21Jan-22Feb-22Mar-22Apr-22May-22Jun-22CBOEVIXONumberofIPOsEY|EYGlobalIPOTrendsQ22022
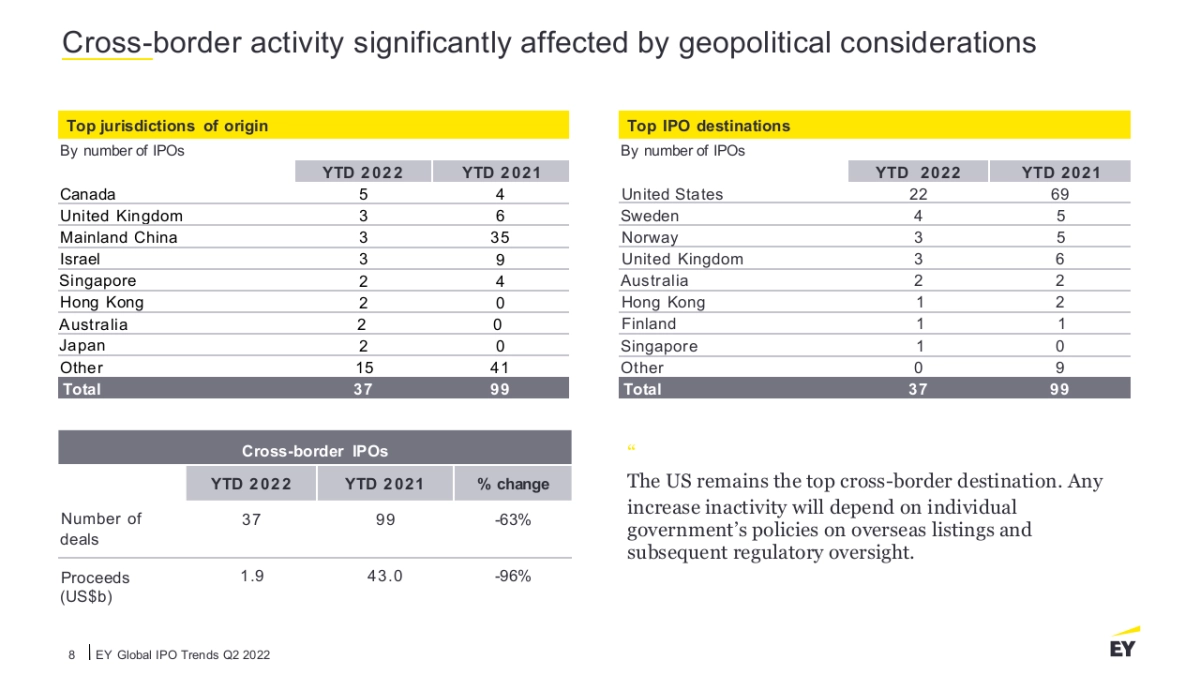
Cross-border activity significantly affected by geopolitical considerationsTopjurisdictionsoforiginTop IPOdestinationsBy numberof IPOsBy numberof IPOsYTD2022YTD2021YTD2022YTD20218588322221CanadaUnited StatesUnitedKingdomSwedenMainlandChinaNorwayIsraelUnitedKingdomSingaporeAustraliaHo...