BCG'TheBosronConsuitingGroupPerspectives onWMATA's ridershipBCG's Presentation toWMATAOCTOBER12,2017metro
Trends in ridershipThree focusareas for today'sMacro-forces driving ridership1hdiscussionPeakoverthehorizon
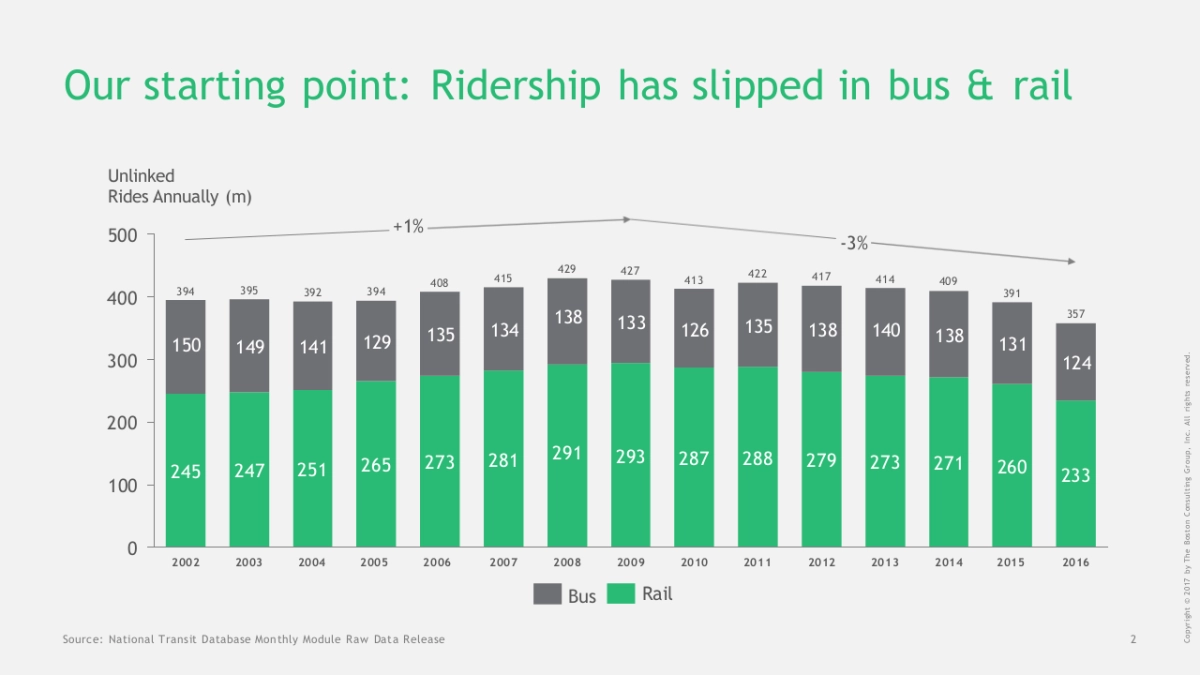
Our starting point: Ridership has slipped in bus & ralUnlinkedRidesAnnuallv(m)5004001381331351351341261381401381501291311491413001242002812912932872882792732452472512652732712602331000200220032004200520062007200820092010201120122013201420152016BusRAilSource: ational Transit Database Monthly Module Raw Data Releas
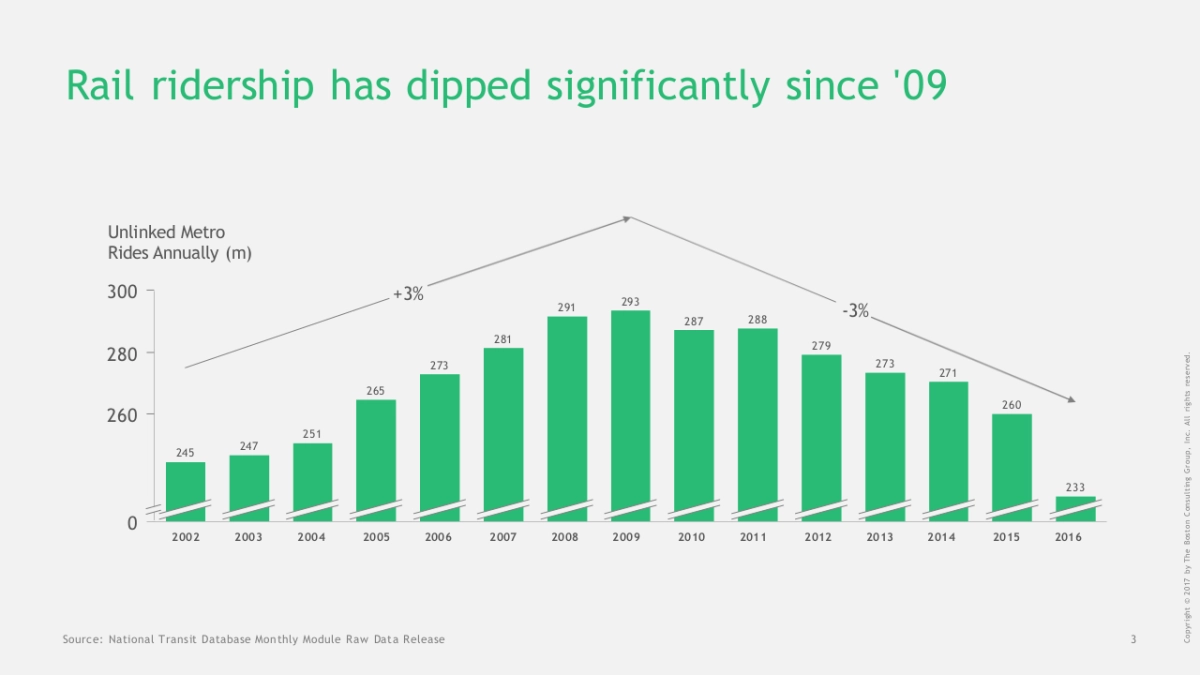
Rail ridership has dipped significantly since 09Unlinked MetroRidesAnnually (m)3002802602512452002200320042007201020152016Source:National Transit Database Monthly Module Raw Data Release
The recent dip is magnified by the "SafeTrack" programUnlinkedRidesAnnual ridership loss-5%Annually(m)since 2014280260-38m)Tripslostsince 2014SafeTrack240Growthordecline2012201320142015201620171unknown for 20171.ESstimated value-extrapolated based onQ1 andQ22017 dataSource: National Transit Database Monthly Module Raw Data Release
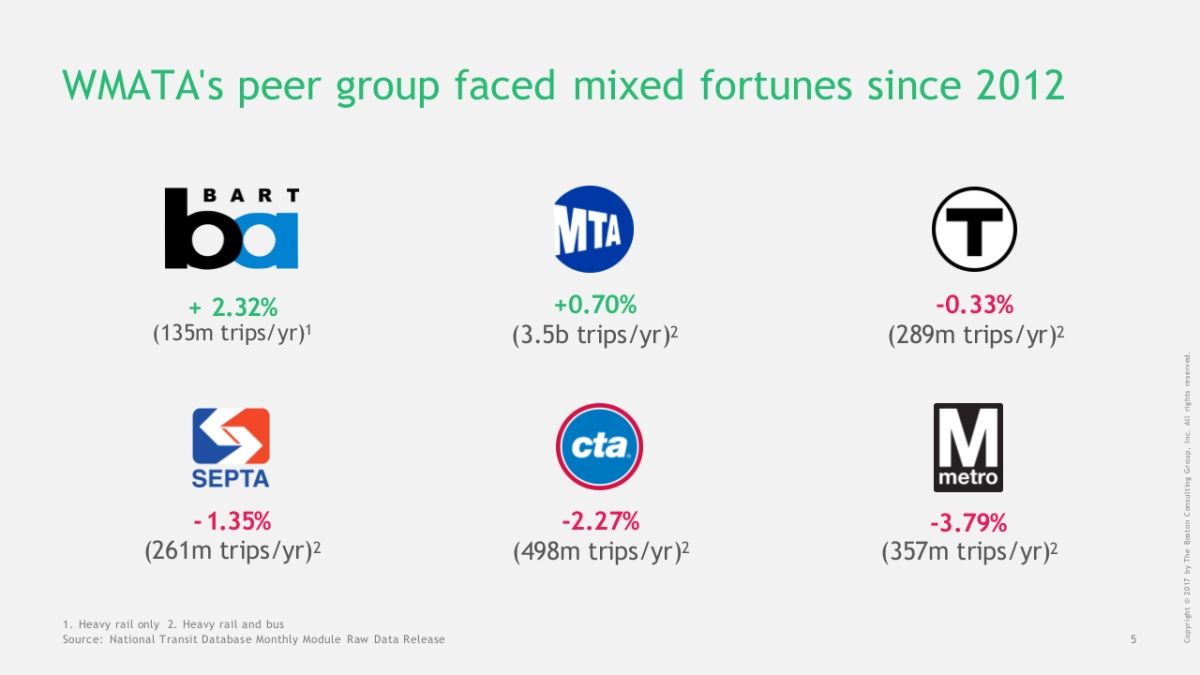
WMATA's peer group facedfortunes since 2012mixedBARTMTA+2.32%+0.70%-0.33%(135m trips/yr)1(3.5b trips/yr)2(289mtrips/yr)ctaSEPTAmetro-1.35%-2.27%-3.79%(261mtrips/yr)2(498mtrips/yr)(357m trips/yr)21.Heavy rail only 2. Heavy rail and busSource: National Transit Database Monthly Module Raw Data Release
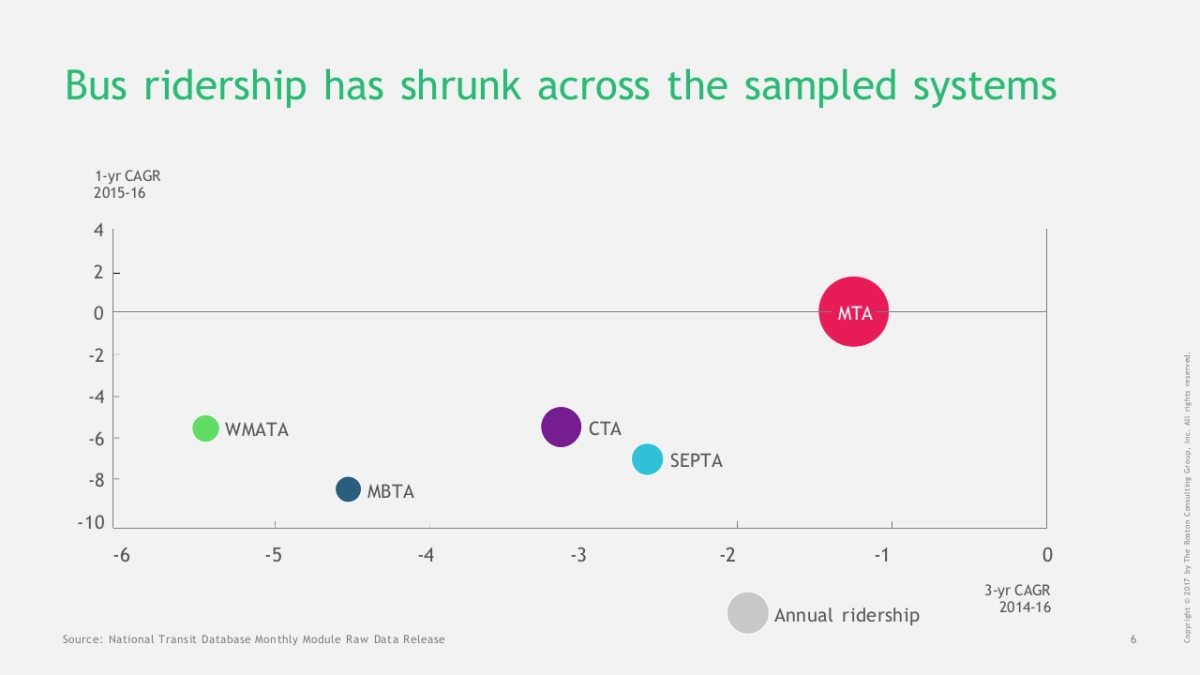
Bus ridership has shrunk across the sampled systems1-yrCAGR2015-1642MTA丁WMATACTA60SEPTAMBTA-10-63-yrCAGRAnnual ridership2014-16Source: National Transit DatabaseMonthly Module Raw Data Release
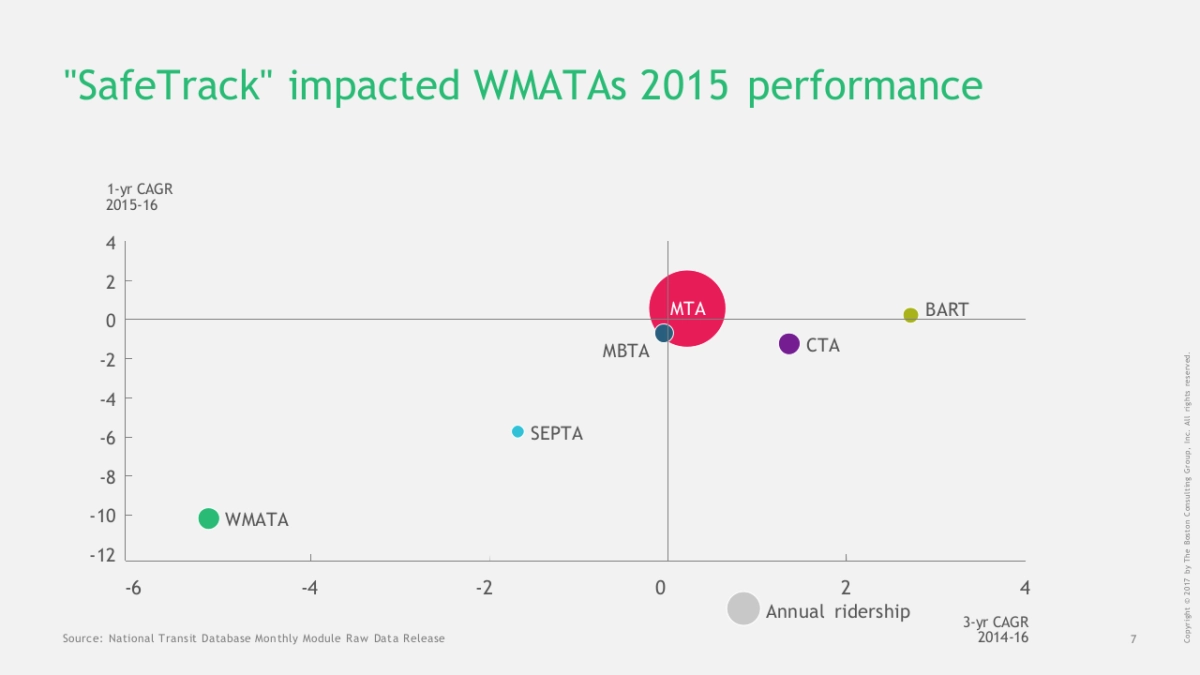
'SafeTrack" impacted WMATAs 2015 performance1-yrCAGR2015-1642MTABARTMBTACTASEPTA10WMATA-12-6-4-20Annual ridership3-yrCAGR2014-16Source: National Transit Database Monthly Module Raw Data Release
Can WMATA takeflight?A series of forces may reshape ridershiptrends in the future
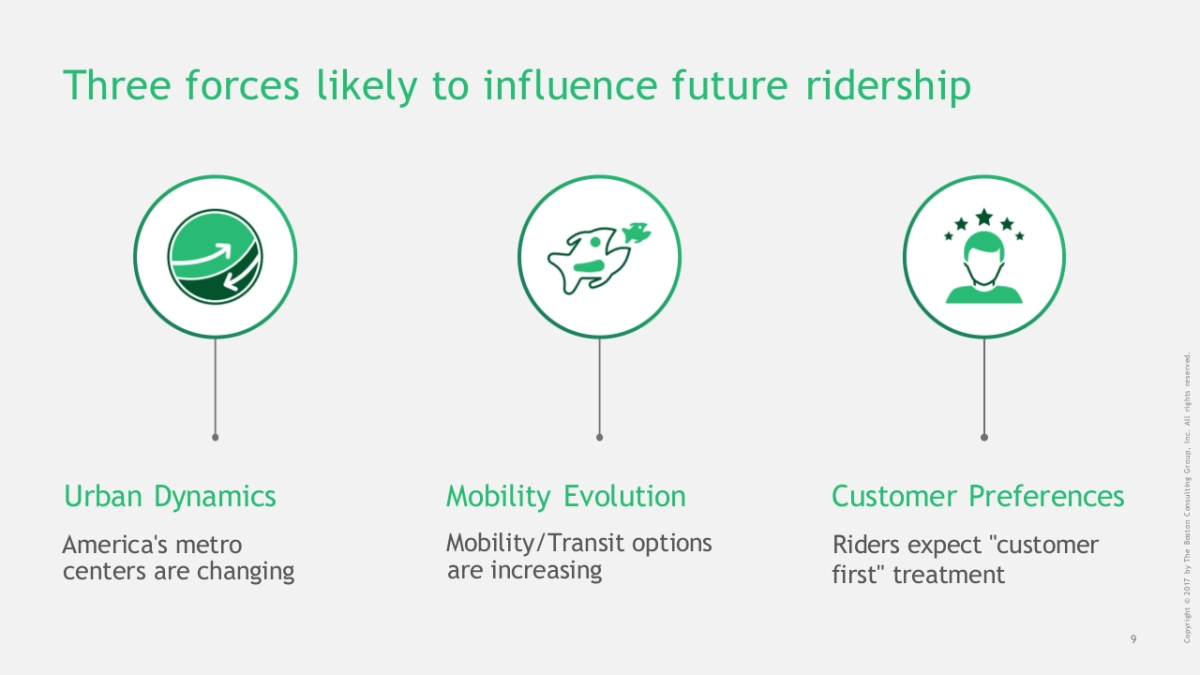
Three'likely to influence future ridershipforcesUrban DynamicsMobility EvolutionCustomer PreferencesAmerica's metroMobility/ Transit options.Riders expect"customer;centers are changingare increasingfirst"'treatment
Larger4 change driversMIin America'sOlderDriversConnectedmetrosRicher
US metros are getting larger and richerChange in GDP Per Capita.2011-2016(2011=100Index ValueUSA3m people added to120these 12 metro areas115110Highest GDP per capitaSFgrowthat 3.5%(CAGR)100-0.5%due to populationDCgrowth>GDP growth201120122013201420152016BostonDetroitMiamSanFrancisco.NYCChicagoHoustonDallasLos AngelesPhiladelphiaWashingtonDCSource:Oxford Analyties;BCG Analysls
PopulationGrowingMetroArea added 300k people since 2011,withDC adding-81kEconomic ConcentrationThe DC StoryHousehold Income up to S75k from $59k forDC, while outer areas experience less upliffIncome InequalitiesAfrican American incomes lagged DC averageby -S40k and white incomes by S88kSource:Oxford Analytics; National Census,BCGAnalysis
US metro's are aging, fastCAGRsince2011(%)32o0-20406080100%ofSampledMetro-1<20yrs20-39vrs40-60yrs60+yrsPopulation in 201623m26m25m18mSource: Oxford Analytis; BCG Analysls
DC MetroArea is getting older, but has plenty of youth,CAGRsince2011(%)30020406080100%ofDCM...