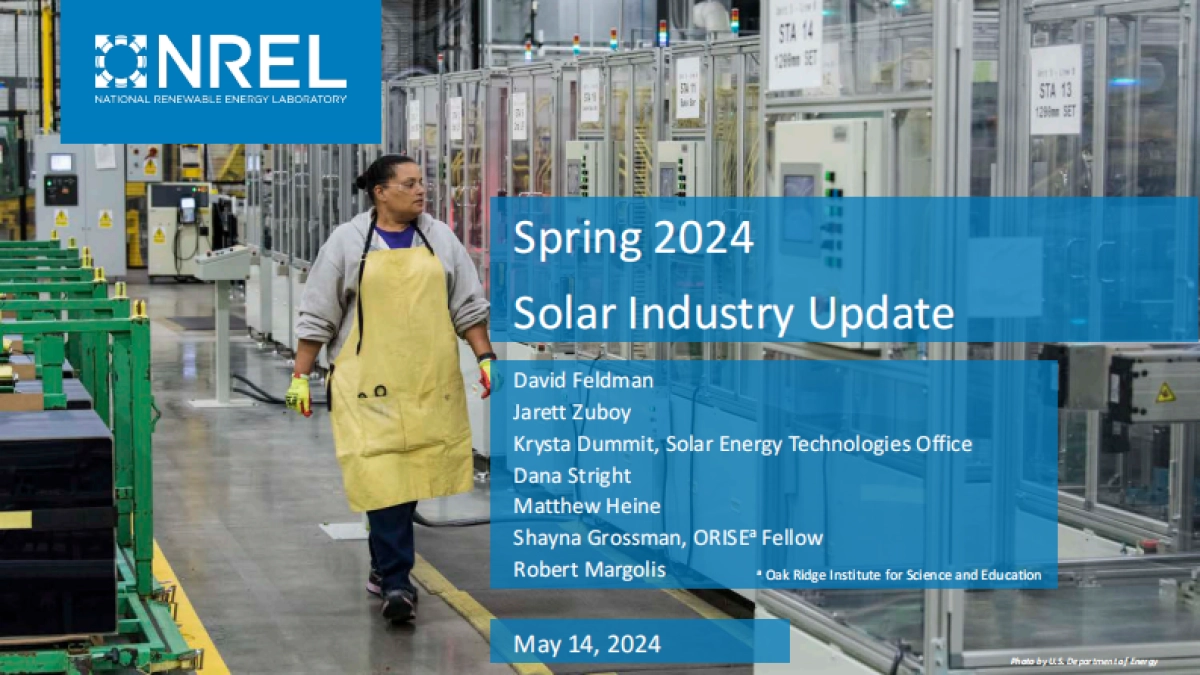
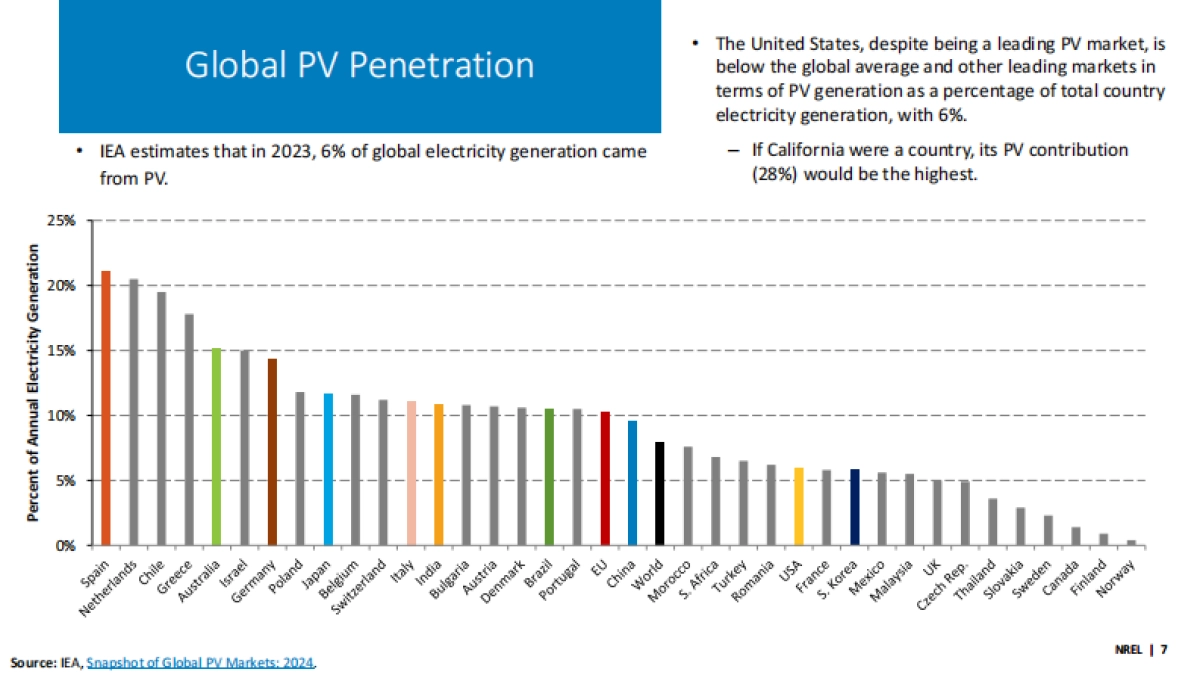
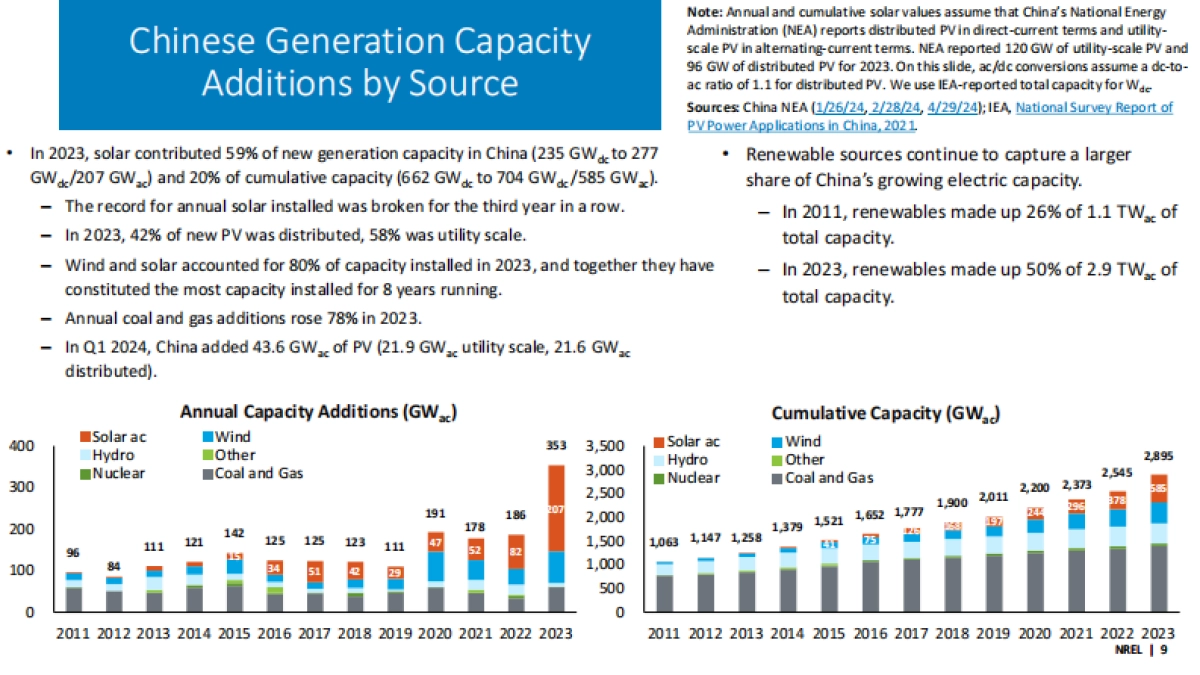
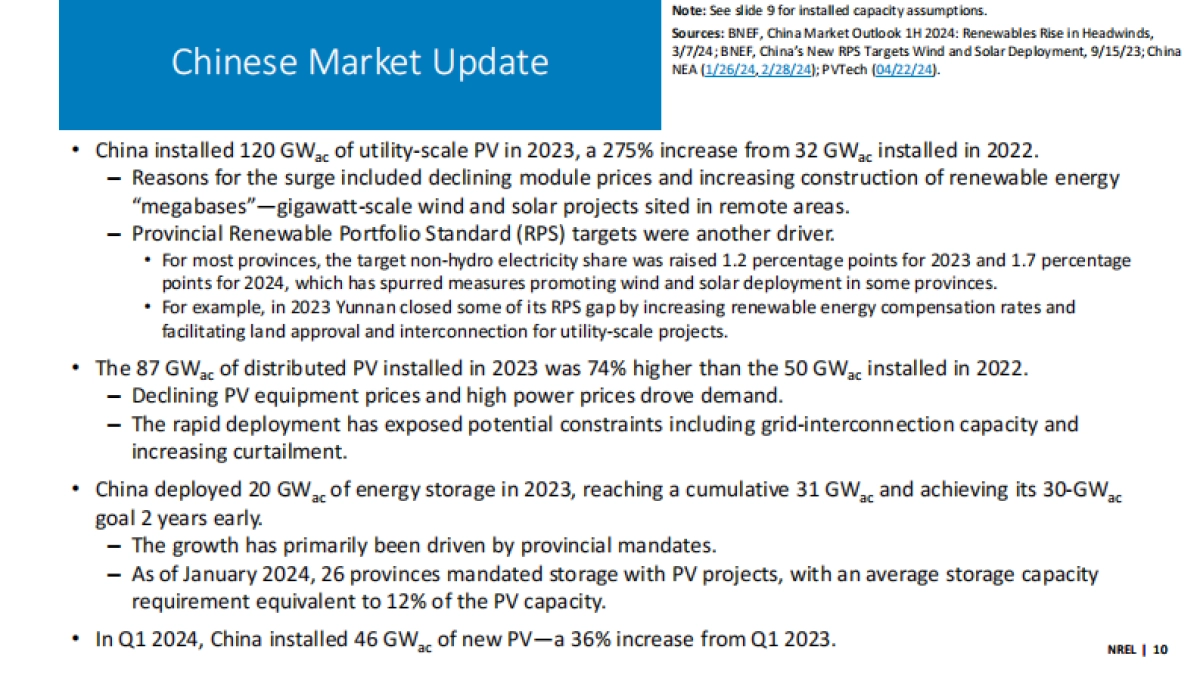
CNRELNATIONALRENEWARLEEMENGYLARORATORNSTA13Spring2024Solar Industrv UpdateDavid FeldmanJarett ZuboyKrystaDummit,SolarEnergyTechnologiesOfficeDanaStrightMatthewHeineShaynaGrossman, ORISEPFellowRobertMargolis'OakRldgelnsitute forSienceandEduationMay14,2024
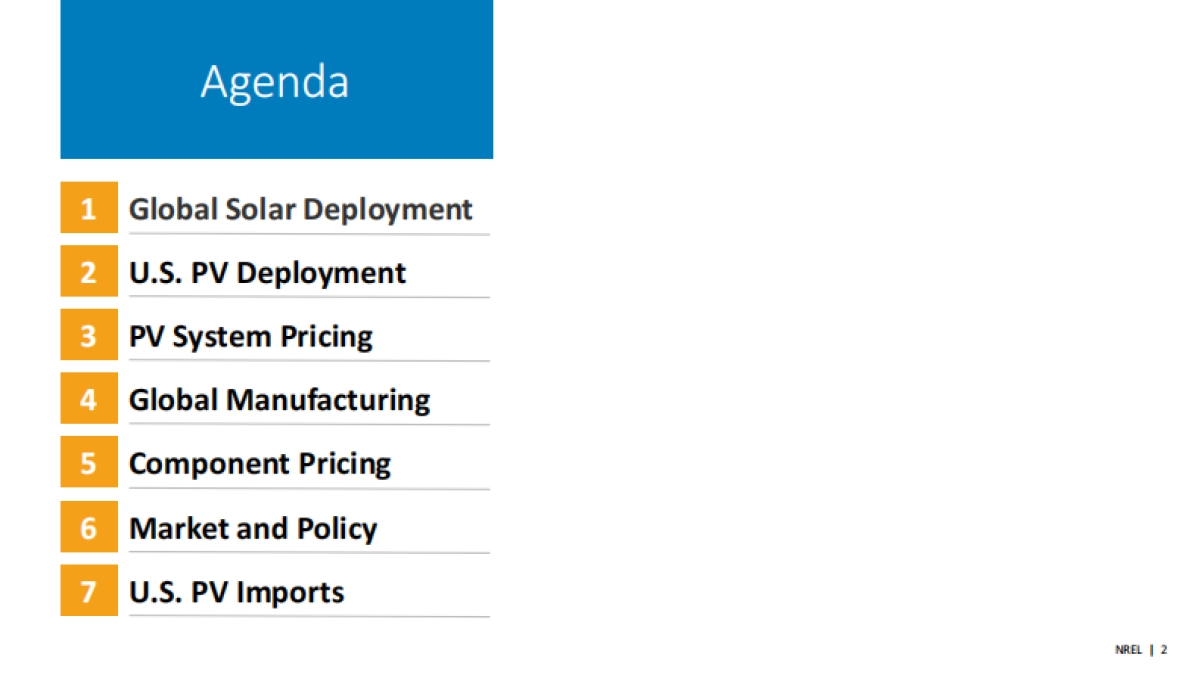
AgendaGlobal Solar DeploymentU.S. PV DeplovmentPV SystemPricingGlobal ManufacturingComponentPricingMarketandPolicyU.S.PV ImportsNREL|2
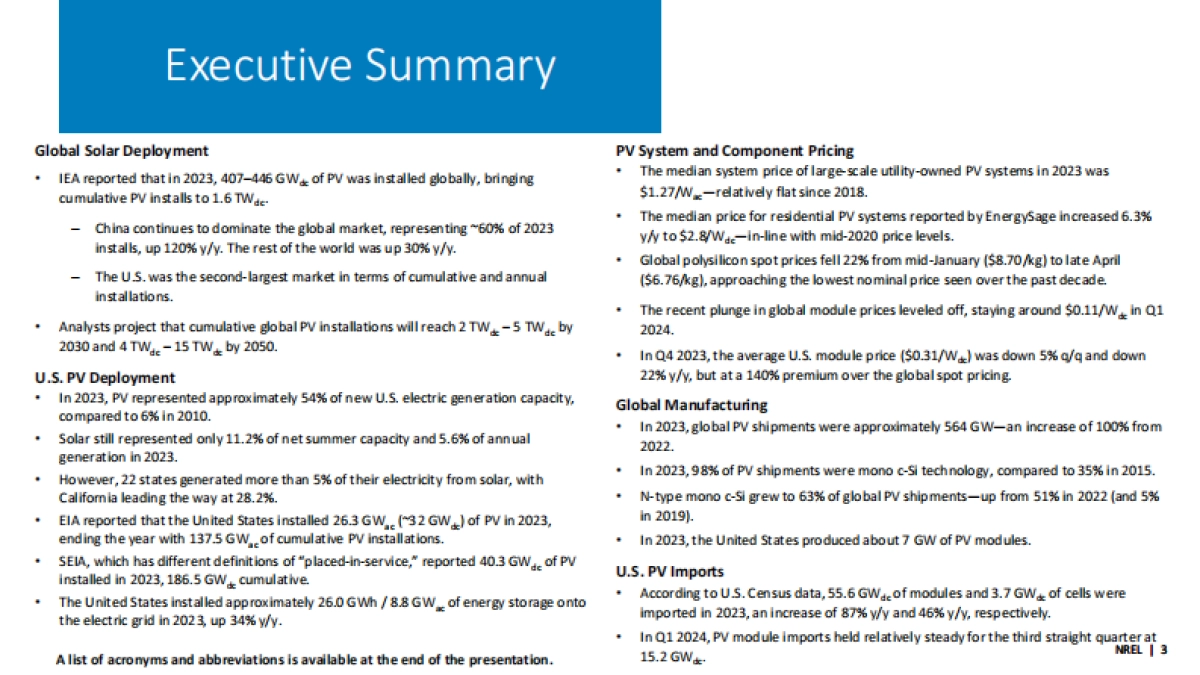
Executive SummaryGlobalSolar DeploymentPVSvstem and Component PricingIE/Areported thatin2023,407-446GWiaofPV wasinsaled gobly, alngingThe medlansystemprlce oflarge-scale utly-ownedPVsystems In 2023 wascumulativePVinstallsto 1.6TWa$1.27MW_-relatively flat since 2018ThemedanprikeforresdentialPV/systemsreportedbyEnergysageIncreased6.3%Chinacontinuestodominate thegobalmarket,representing-60%of2023Installs,up 120%y/.Therestof the world wasup30%y/y.The U.S.was the second- largest market In terms of cumulat lve and annual(56.76/Akgl].approaching thelowestnominalprice seen overthe past decadeThe recent plunge Inglobal module prices leveled off,staying around $0.1/W.Iin a1Analysts project that cumulative global PV installatons wll each 2TW.g-5 TWa. by2030 and4TW-15TWby2050.InQ42023,the averageU.S.moduleprice (50.31/Wa)wasdown5%a/qand downL,PVrepresented approximately54%ofnewU.S,electrk;generation capactvyedto 6% in2010In2023,globalPVshipmentswereapproximately564GW-anIncreaseof100%frompresented only 11.2% of net summer capacity and5.6% of annual202222 states generatedmore than 5%ofthelr electricity fromsolar, withIlforlaleadingthewayat28.2%N-type mono c-Si grew to 63% of global Pv shipments-up from 51% In 2022(and 5%ted thatthe United States Instaed 26.3 GW, (32 GW,Jof PV/ In2023,in 2019).with137.5 GW. of cumul atIve PV InstallatlonsIn 2023 the United States produced about7 GW of PV modules.s different definitions of"placed-Inh-service." reported 40.3 GW. of PVdIin 2023,186.5GWa cumulative.U.S.PV ImportsAcordina toU.S.Census data,5. 6 GW, of modules and 3.7 GW,@of cells wereheUnitedStates Installedapproximately26.0GWh/8.8GW._ofenergystorageontoImported In2023, anlncrease of 87%;yly and46%y/y, respectively.InQ12024,pVmodule lmportsheld relathvelysteadyforthe thlrd straight quat
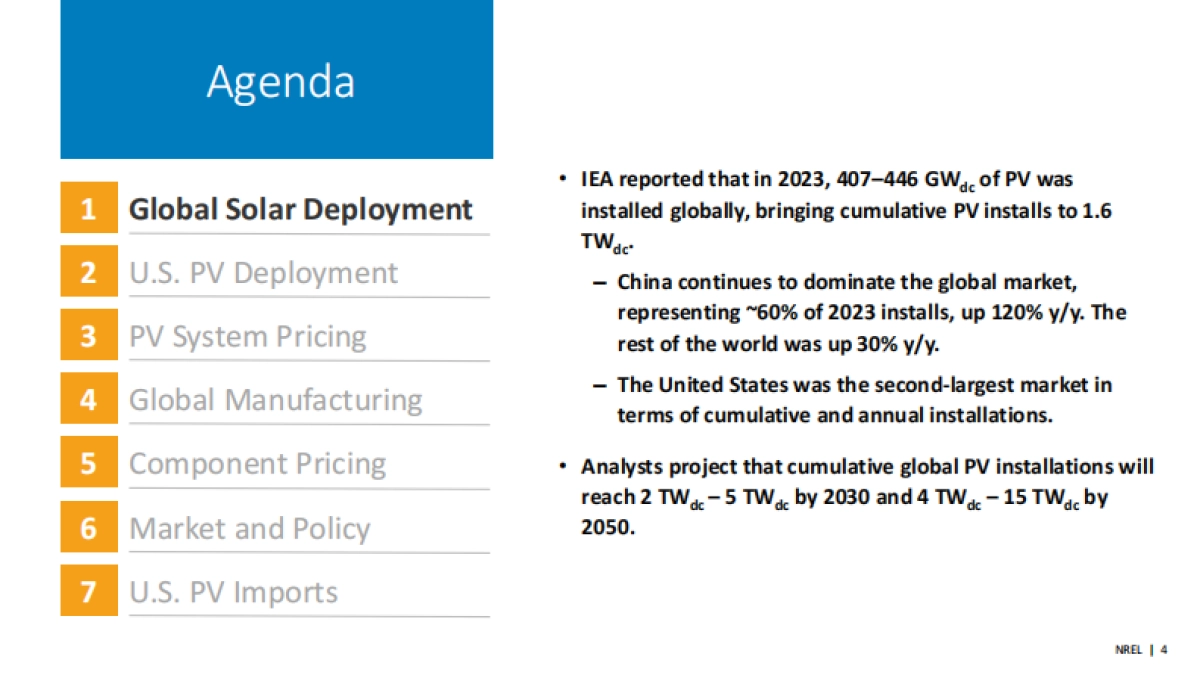
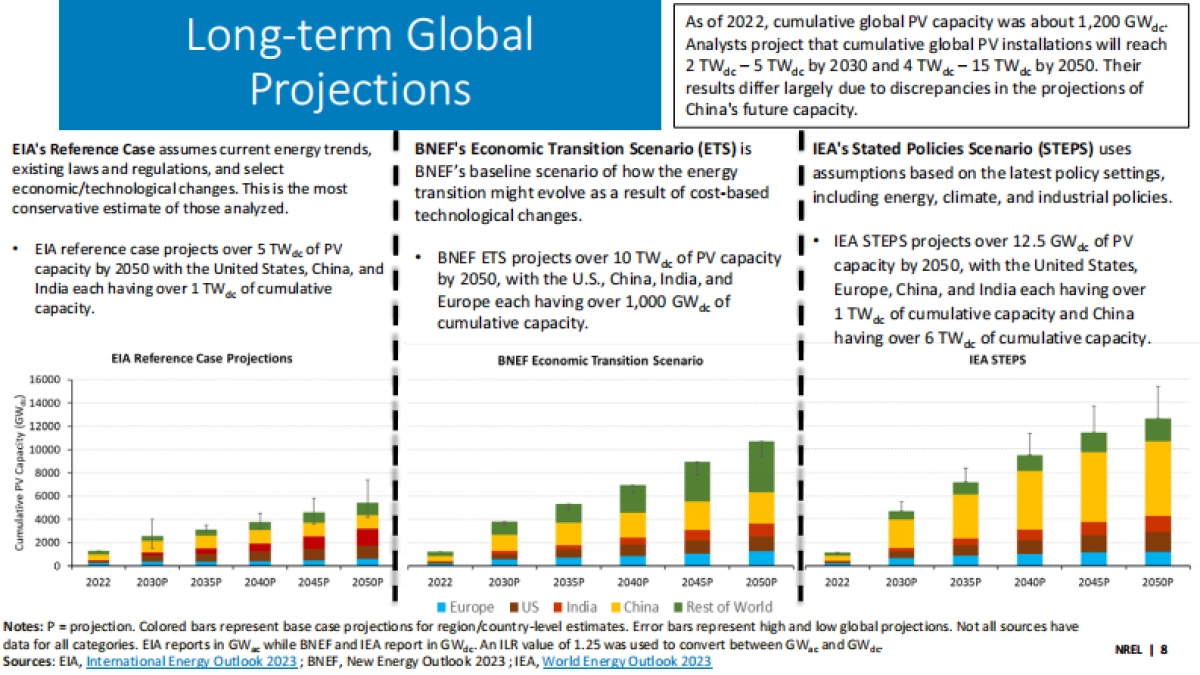
AgendaIEA reported that in 2023,407-446 GWa ofPV wasGlobalSolar Deploymentinstalled globaly, bringing cumulative PVinstalls to1.6TWacUL.S.PV DeplovmentChina continues to dominatethe globalmarket,representing~60% of2023installs, up 120%y/y.ThePV Svstem Pricingrest of the world wasup30%ylyThe United States was the second-largest market inGlobal Manufacturingterms of cumulative and annual installations.Component PricingAnalystsproject that cumulative globalPV installations wilreach2 TWa-5 TWa by 2030 and4 TW&-15TWabyMarket and Policy2050.U.S. PV ImportsNREL|4
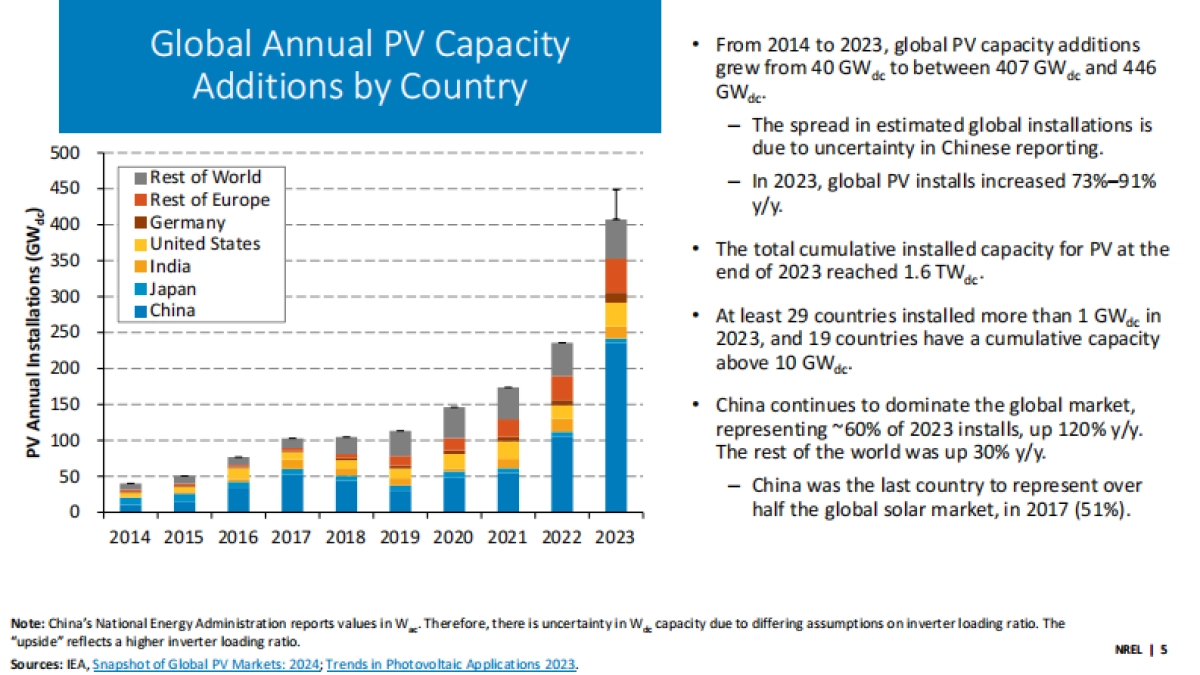
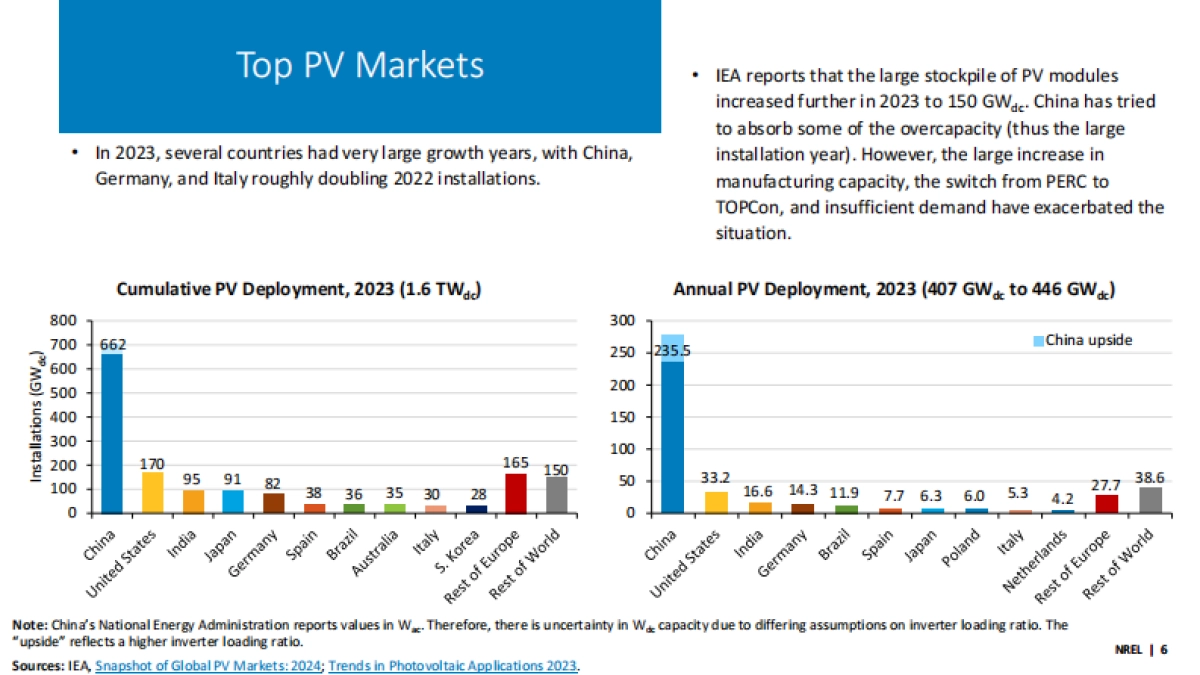
Global Annual PV CapacityFrom 2014 to 2023. elobal PV capacity additionsgrew from40GWa to between 407 GWa and 446AdditionsbyCountryGWacThe spread in estimated global installations is500due to uncertainty in Chinesereporting,Rest of WorldIn2023.globalPVinstallsincreased73%-91%450mRest ofEurope("MD)suopelesuJenuuy ...