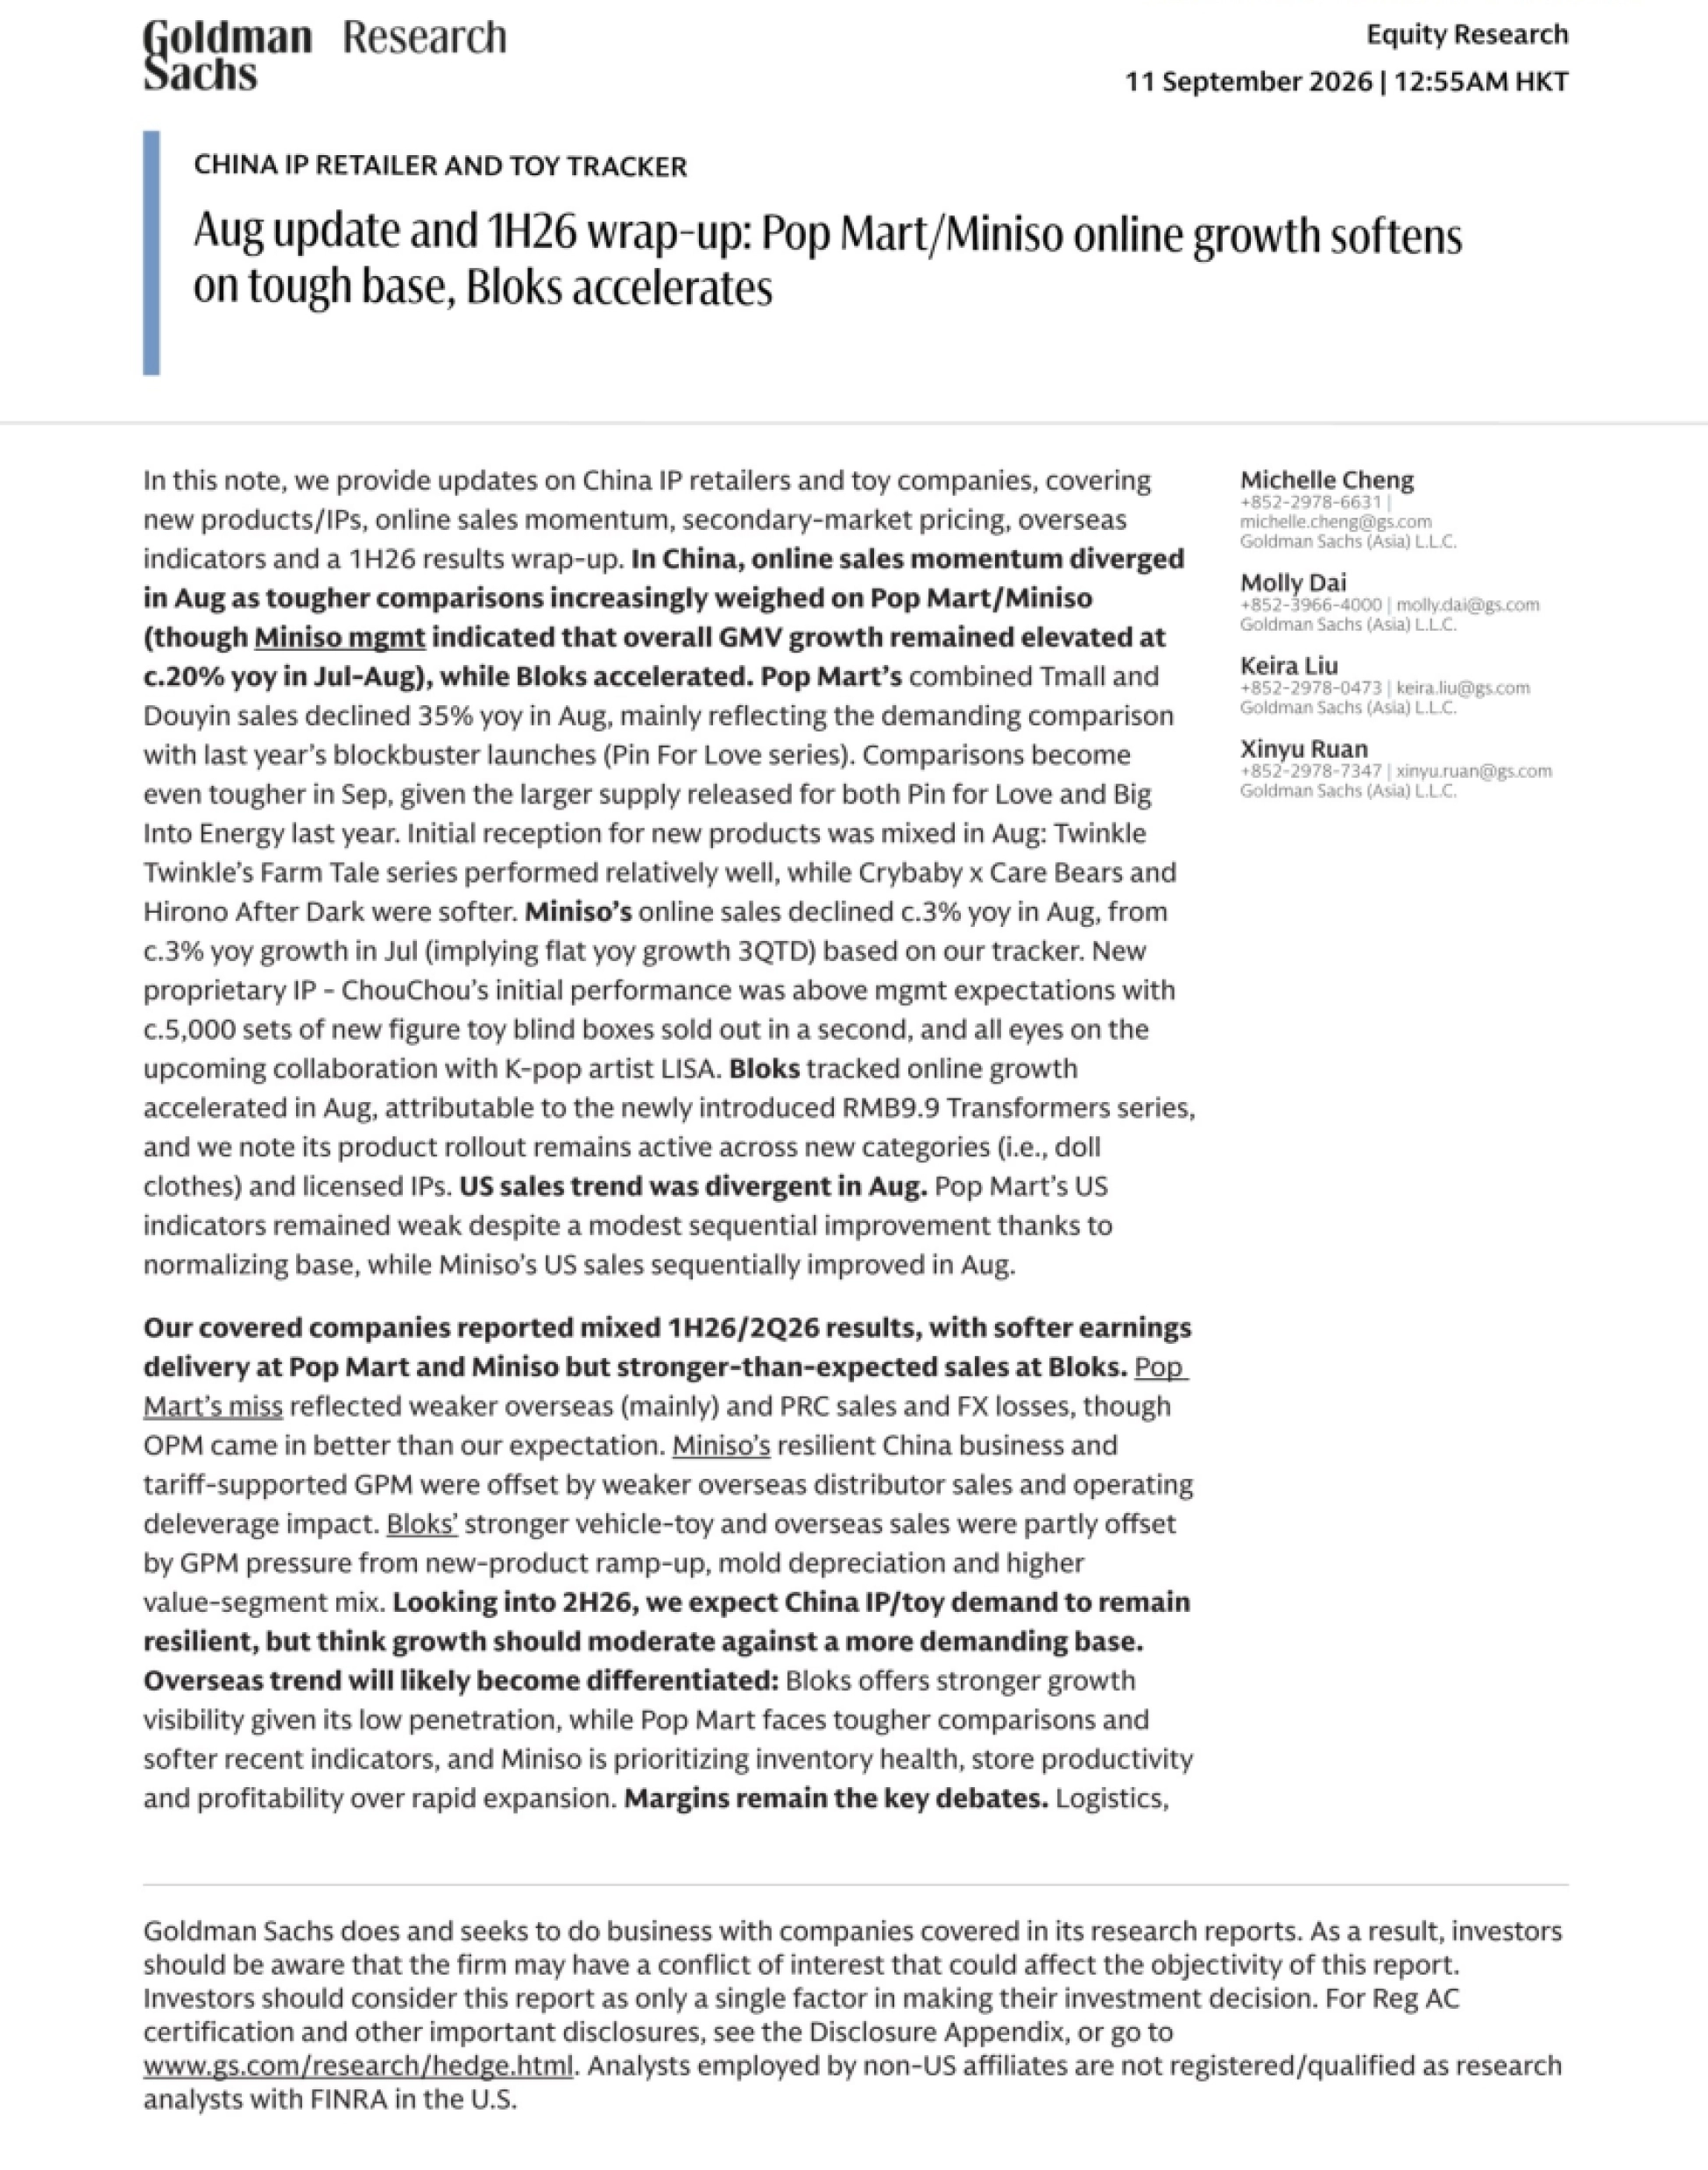
0JPFWGiAqW9ZaY9PdN9PoMoOoMrPfQpPxOlOrQnM7NrQnNxNrNuMMYnPnRGoldman SachsChina IP Retailer and Toy Trackerprocurement and product/geographical mix are likely to constrain GPM, while overseasDTC deleverage may pressure Pop Mart's and Miniso's OPEX ratios; Bloks could achievebetter scale leverage, although overseas supply-chain investment remains an offset.Shareholder-return signals were also mixed, with buyback support from Pop Mart, nointerim dividend from Miniso despite its retained full-year return commitment, and thefirst interim dividend from Bloks. More details within.11 September 2026Goldman SachsChina IP Retailer and Toy TrackerDisclosure AppendixReg ACWe, Michelle Cheng, Molly Dai and Keira Liu, hereby certify that all of the views expressed in this report accurately reflect our personal views about thesubject company or companies and its or their securities. We also certify that no part of our compensation was, is or will be, directly or indirectly,related to the specific recommendations or views expressed in this report.Unless otherwise stated, the individuals listed on the cover page of this report are analysts in Goldman Sachs' Global Investment Research division.Contributing Authors: Michelle Cheng Goldman Sachs (Asia) L.L.C., Molly Dai Goldman Sachs (Asia) L.L.C., Keira Liu Goldman Sachs (Asia) L.L.C., XinyuRuan Goldman Sachs (Asia) L.L.C..Unless otherwise stated, the individuals listed in the Contributing Authors disclosure of this report are analysts in Goldman Sachs' Global InvestmentResearch division.GS Factor ProfileThe Goldman Sachs Factor Profile provides investment context for a stock by comparing key attributes to the market (i.e. our universe of rated stocks)and its sector peers. The four key attributes depicted are: Growth, Financial Returns, Multiple (e.g. valuation) and Integrated (a composite of Growth,Financial Returns and Multiple). Growth, Financial Returns and Multiple are calculated by using normalized ranks for specific metrics for each stock. Thenormalized ranks for the metrics are then averaged and converted into percentiles for the relevant attribute. The precise calculation of each metric mayvary depending on the fiscal year, industry and region, but the standard approach is as follows:Growth is based on a stock's forward-looking sales growth, EBITDA growth and EPS growth (for financial stocks, only EPS and sales growth), with ahigher percentile indicating a higher growth company. Financial Returns is based on a stock's forward-looking ROE, ROCE and CROCI (for financialstocks, only ROE), with a higher percentile indicating a company with higher financial returns. Multiple is based on a stock's forward-looking P/E, P/B,price/dividend (P/D), EV/EBITDA, EV/FCF and EV/Debt Adjusted Cash Flow (DACF) (for financial stocks, only P/E, P/B and P/D), with a higher percentileindicating a stock trading at a higher multiple. The Integrated percentile i...