电脑桌面
添加运营动脉到电脑桌面
安装后可以在桌面快捷访问

IREA-减少:非生物可再生能源(英文)会员免费

IREA-减少:非生物可再生能源(英文)_第1页
1/47
IREA-减少:非生物可再生能源(英文)_第2页
2/47
IREA-减少:非生物可再生能源(英文)_第3页
3/47
IREA-减少:非生物可再生能源(英文)_第4页
4/47
IREA-减少:非生物可再生能源(英文)_第5页
5/47
IREA-减少:非生物可再生能源(英文)_第6页
6/47
IREA-减少:非生物可再生能源(英文)_第7页
7/47
IREA-减少:非生物可再生能源(英文)_第8页
8/47
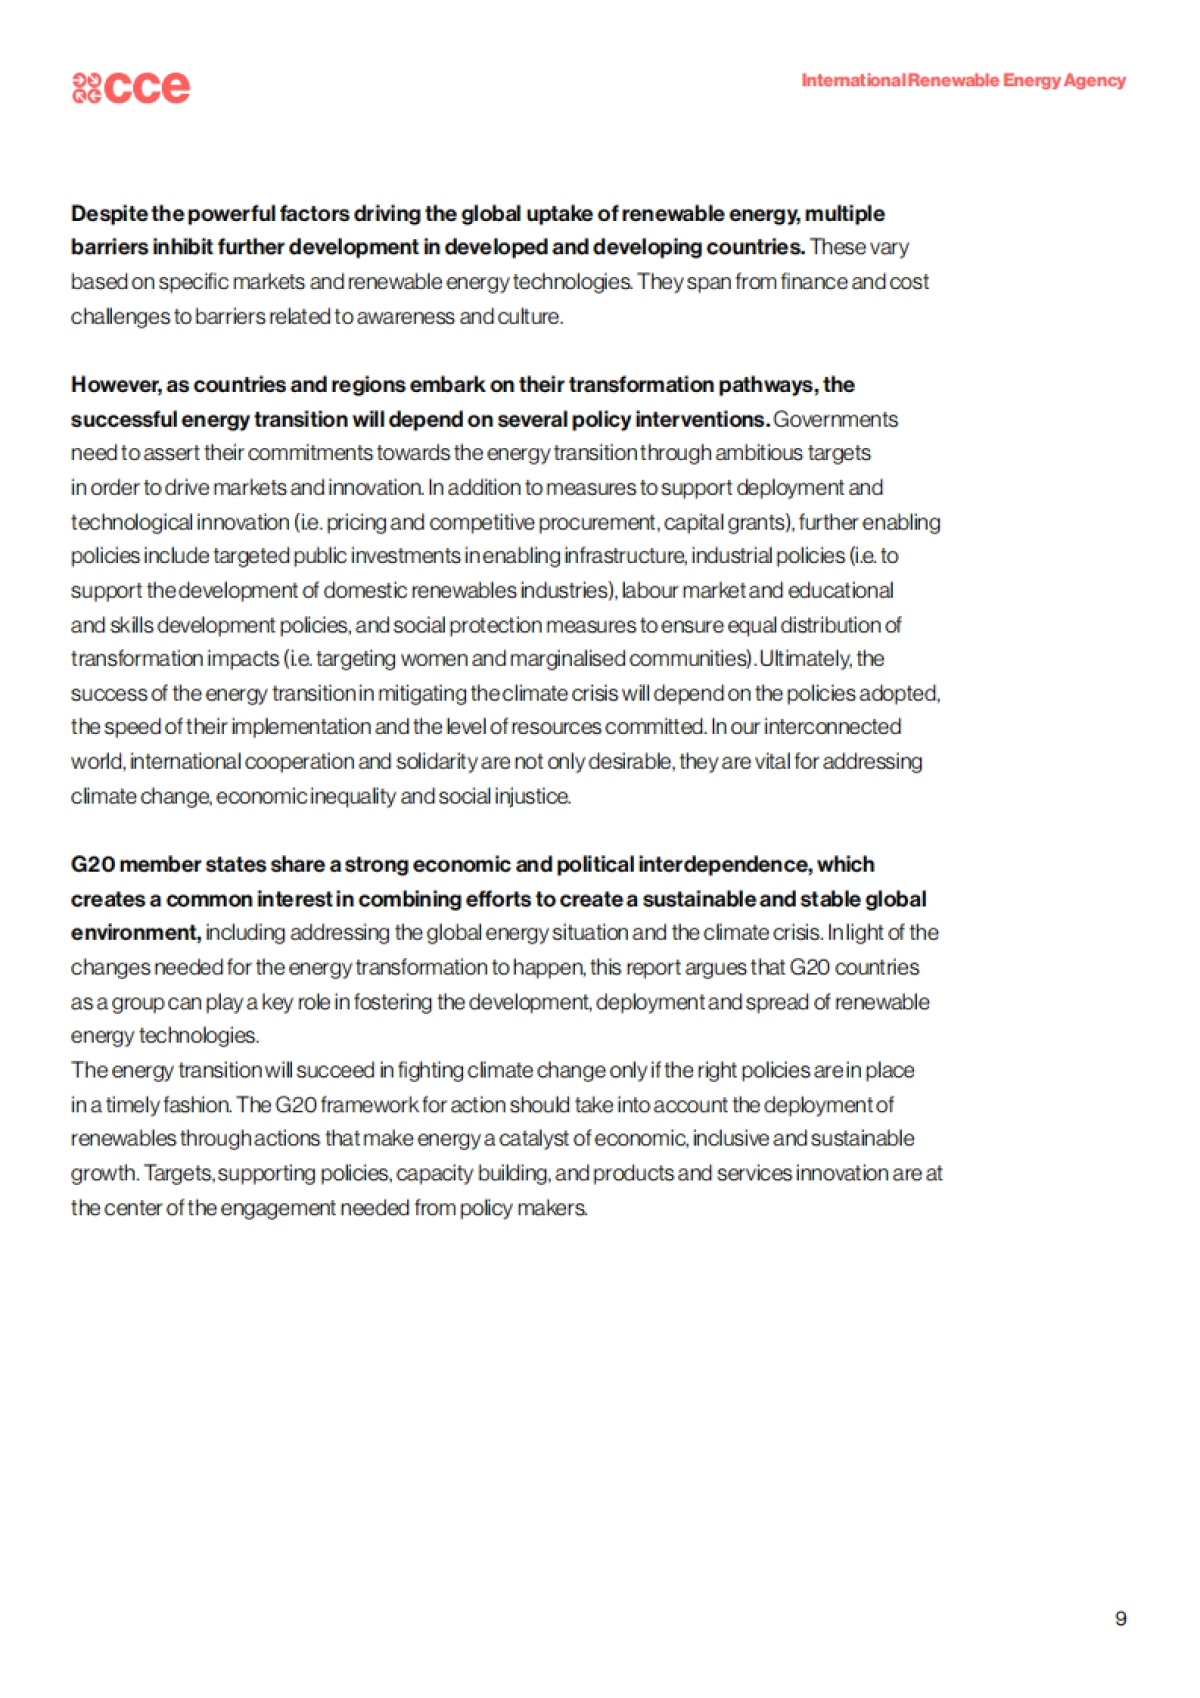
IREA-减少:非生物可再生能源(英文)_第9页
9/47
IREA-减少:非生物可再生能源(英文)_第10页
10/47
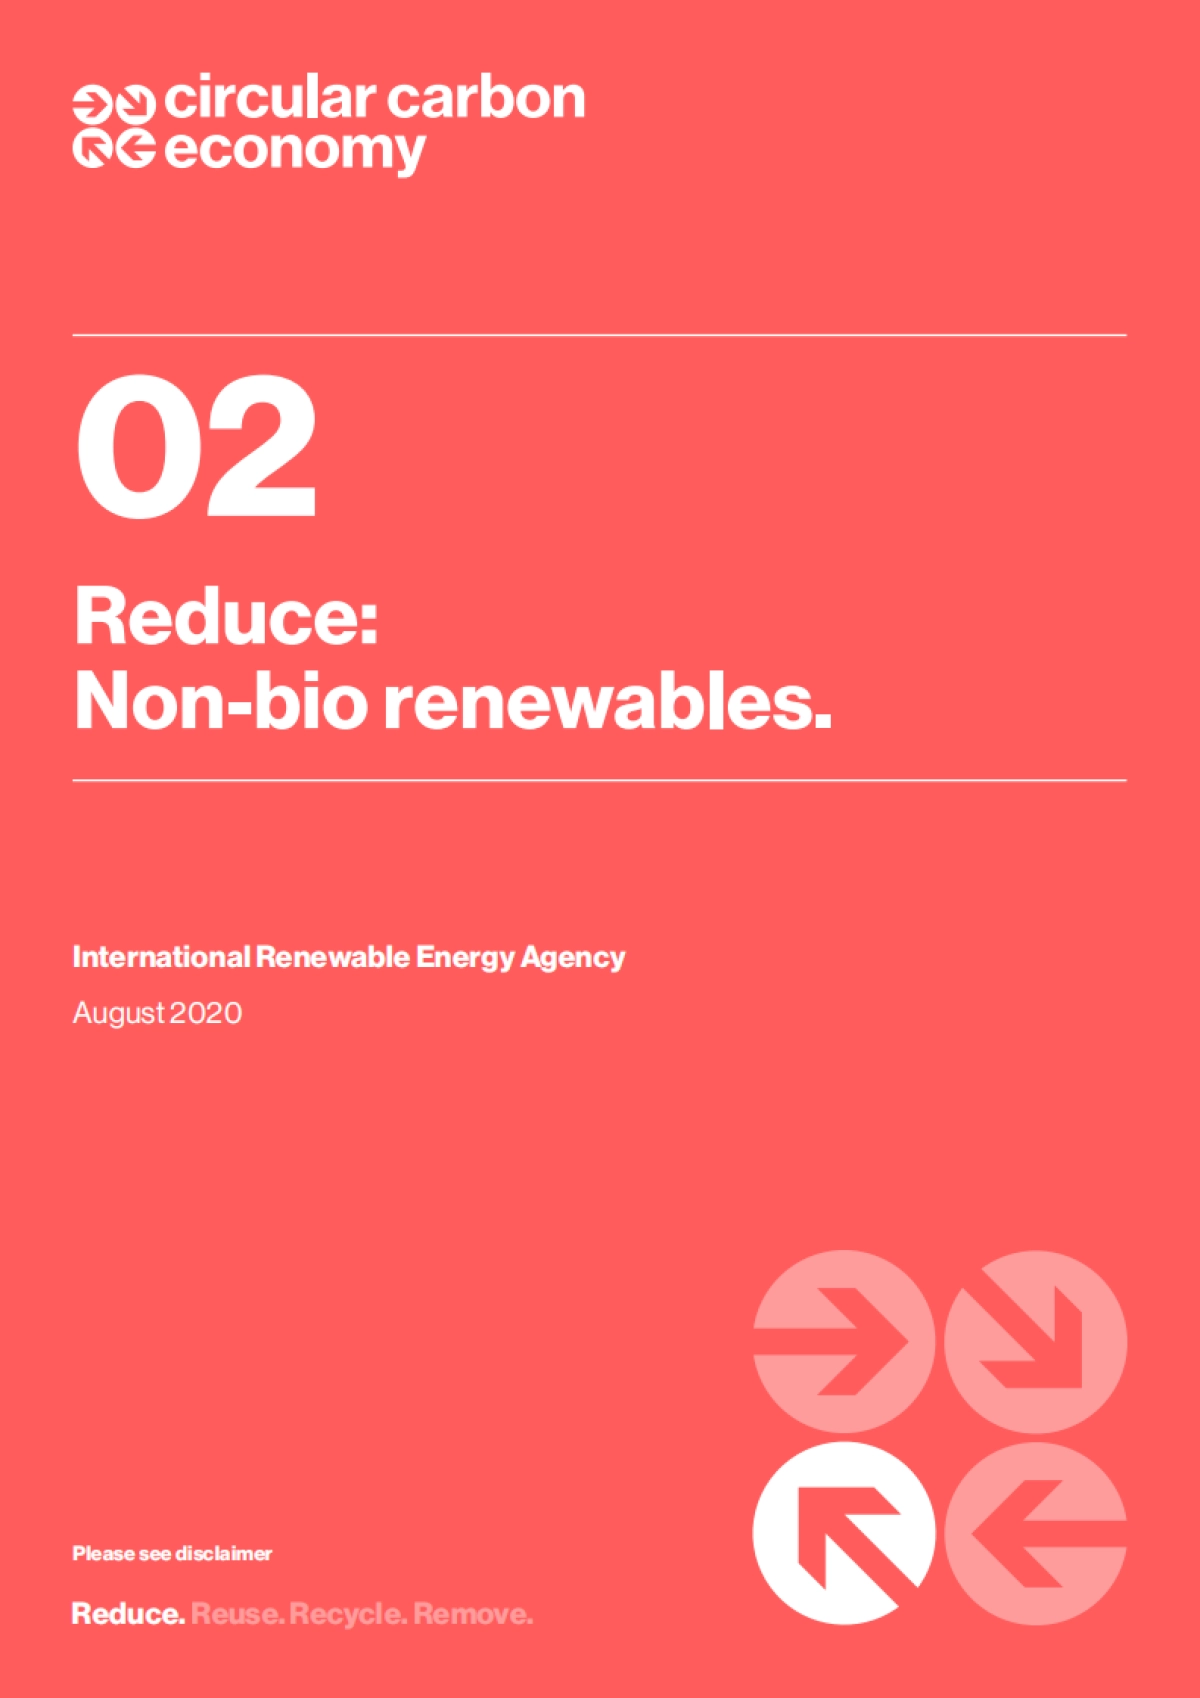
International Renewable Energy Agency0102Reduce. Reuse.Recycle. Remove.August 2020Please see disclaimerInternational Renewable Energy AgencyReduce: Non-bio renewables.

International Renewable Energy AgencyThe views in this report are those of IRENA and do not necessarily reflect the official views of the G20 Members collectively or individually or of KAPSARC.

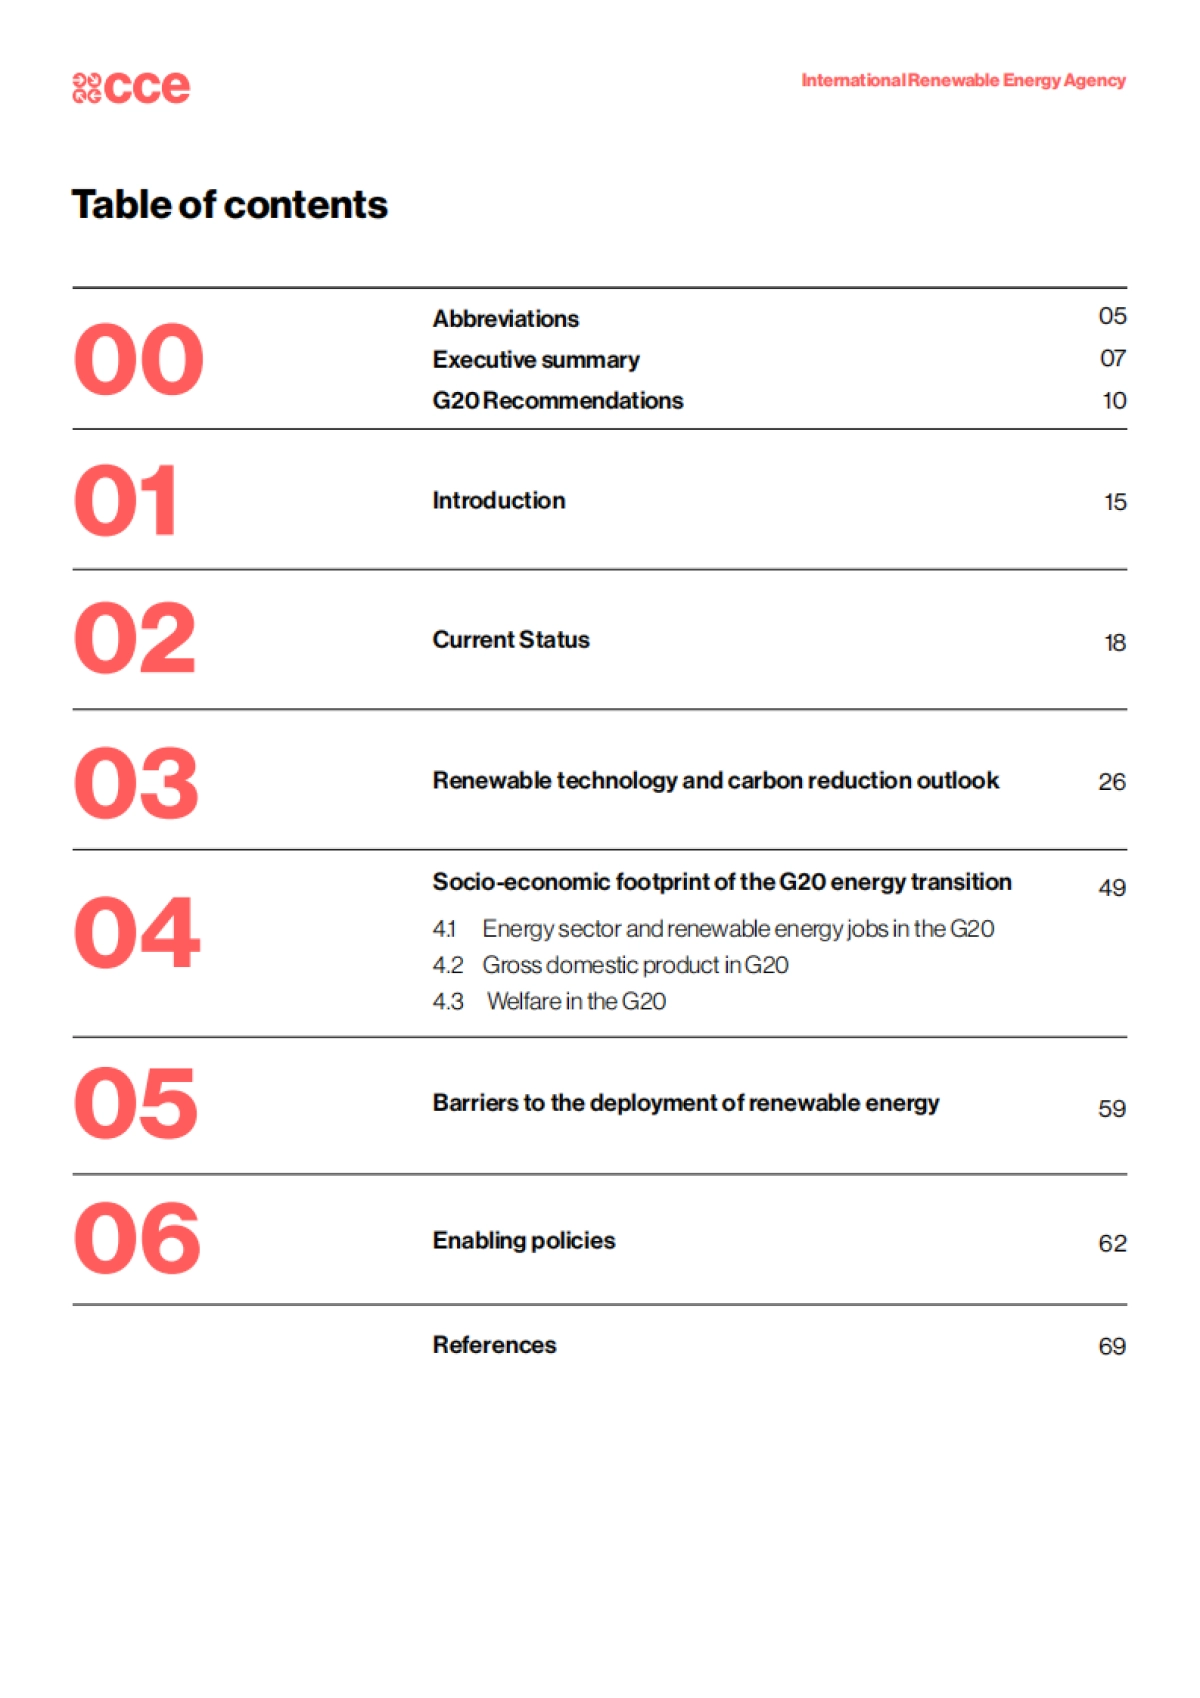
qNtPsQyQzRaQaOaQmOpPmOpPiNqQxOkPsRrRaQrQqOuOsQrNNZoOqOInternational Renewable Energy AgencyTable of contents00010203Abbreviations Executive summaryG20 RecommendationsIntroductionCurrent StatusRenewable technology and carbon reduction outlook050710151826References62690405064959Socio-economic footprint of the G20 energy transition4.1 Energy sector and renewable energy jobs in the G20 4.2 Gross domestic product in G20 4.3 Welfare in the G20 Barriers to the deployment of renewable energyEnabling policies

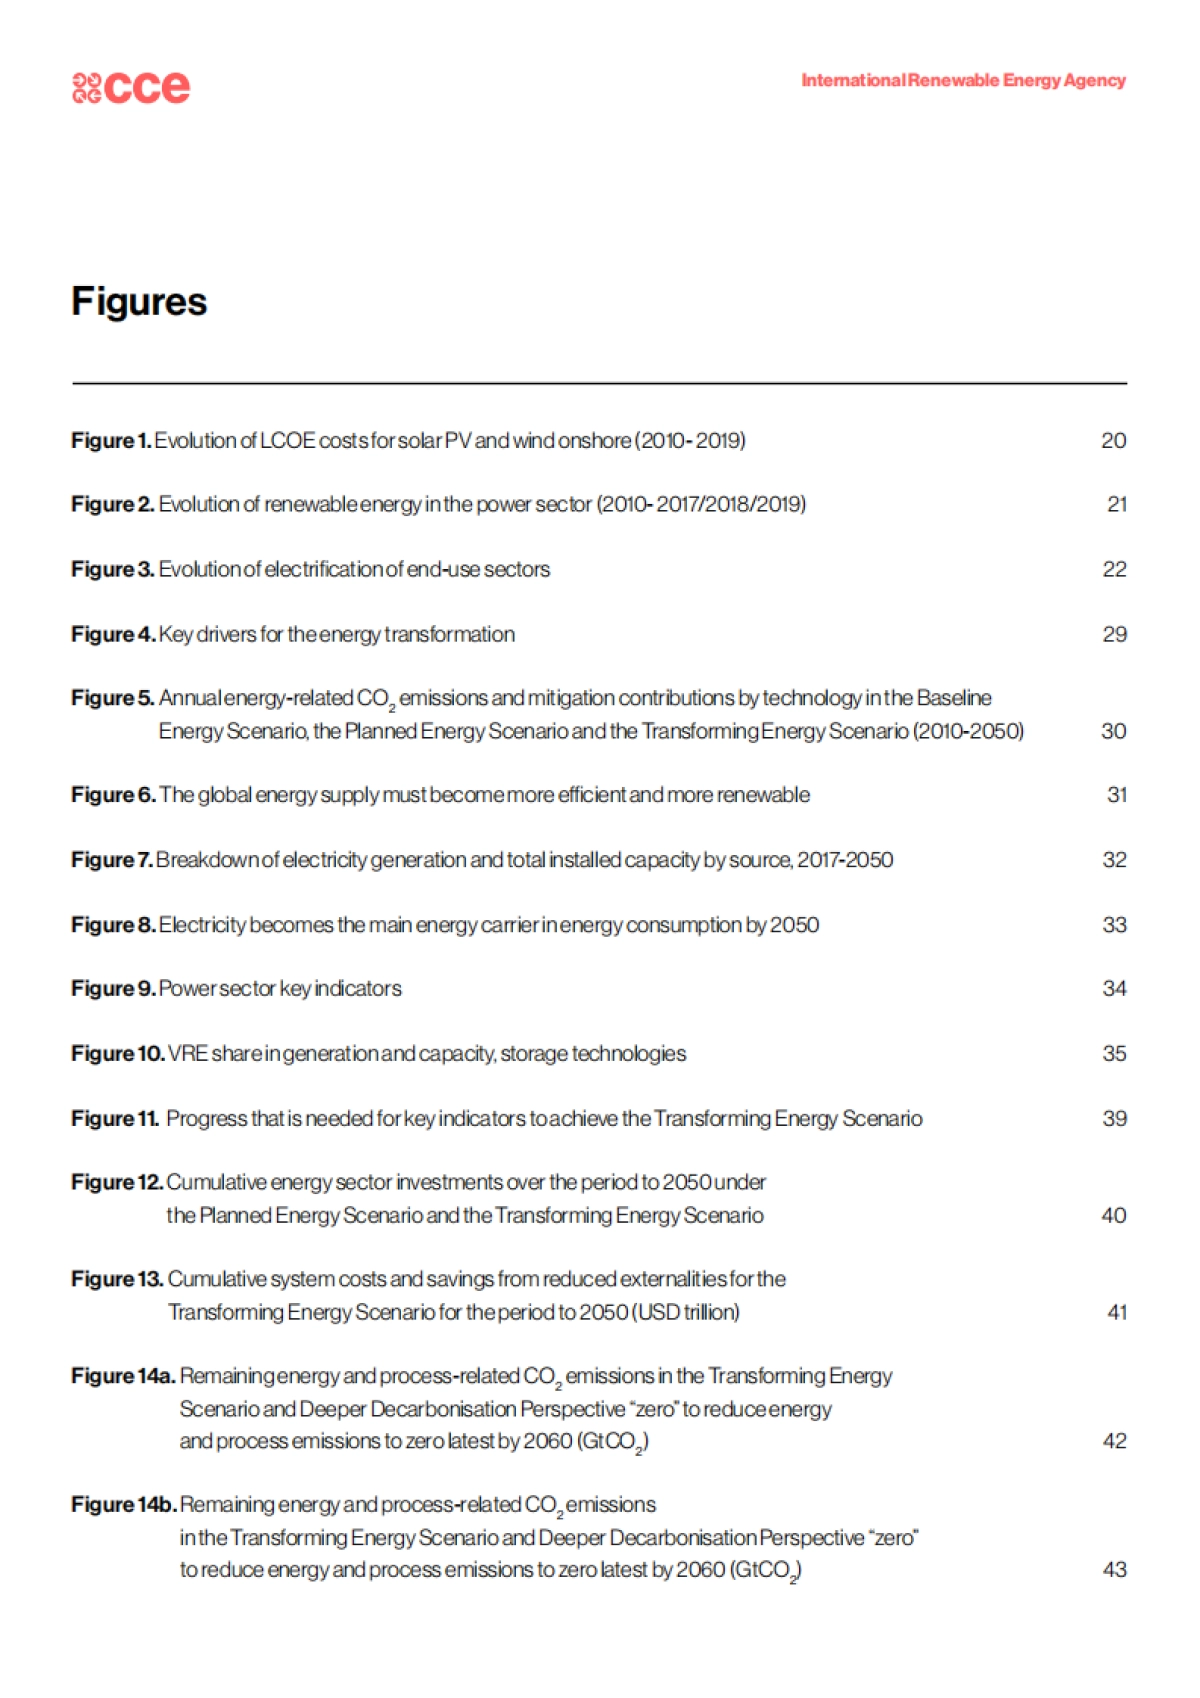
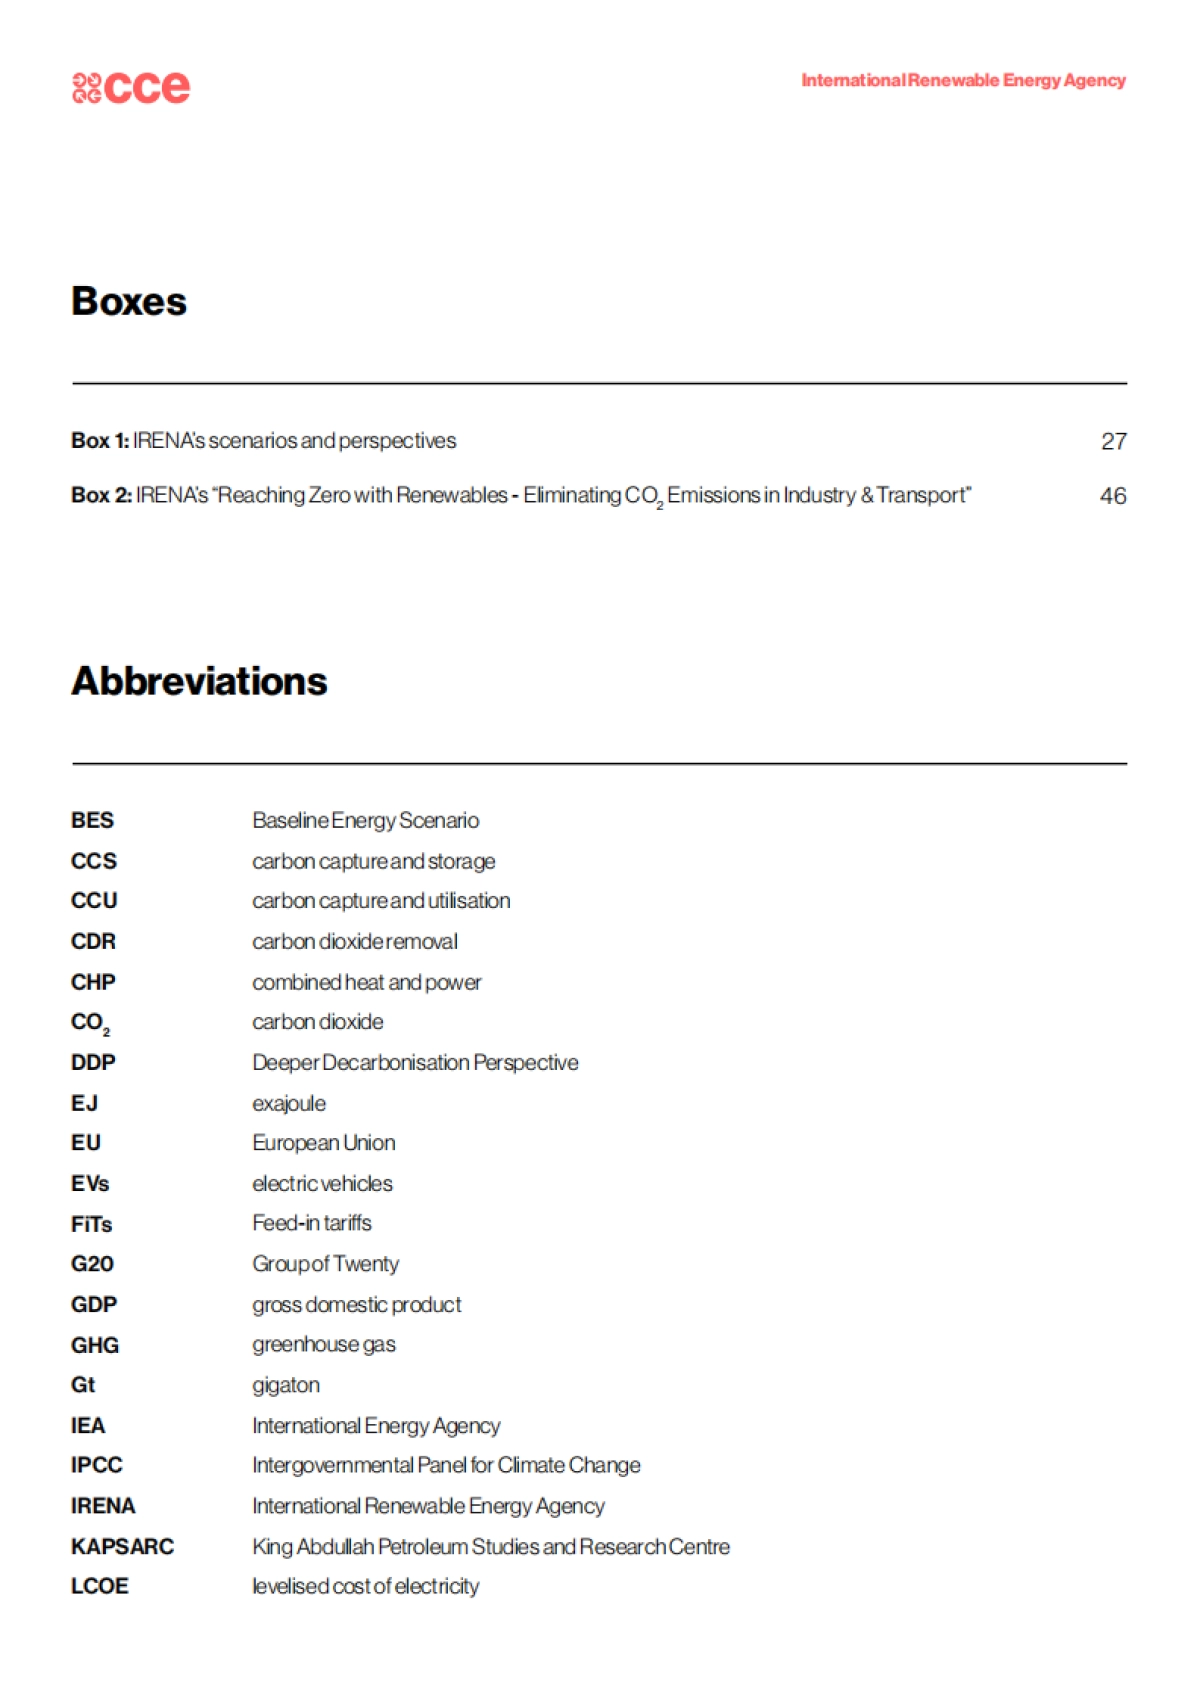
International Renewable Energy AgencyFiguresFigure 1. Evolution of LCOE costs for solar PV and wind onshore (2010- 2019) 20Figure 2. Evolution of renewable energy in the power sector (2010- 2017/2018/2019) 21Figure 3. Evolution of electrification of end-use sectors 22Figure 4. Key drivers for the energy transformation 29Figure 5. Annual energy-related CO2 emissions and mitigation contributions by technology in the Baseline Energy Scenario, the Planned Energy Scenario and the Transforming Energy Scenario (2010-2050) 30Figure 6. The global energy supply must become more efficient and more renewable 31Figure 7. Breakdown of electricity generation and total installed capacity by source, 2017-2050 32Figure 8. Electricity becomes the main energy carrier in energy consumption by 2050 33Figure 9. Power sector key indicators 34Figure 10. VRE share in generation and capacity, storage technologies 35Figure 11. Progress that is needed for key indicators to achieve the Transforming Energy Scenario 39Figure 12. Cumulative energy sector investments over the period to 2050 under the Planned Energy Scenario and the Transforming Energy Scenario 40Figure 13. Cumulative system costs and savings from reduced externalities for the Transforming Energy Scenario for the period to 2050 (USD trillion) 41Figure 14a. Remaining energy and process-related CO2 emissions in the Transforming Energy Scenario and Deeper Decarbonisation Perspective “zero” to reduce energy and process emissions to zero latest by 2060 (GtCO2) 42Figure 14b. Remaining energy and process-related CO2 emissions in the Transforming Energy Scenario and Deeper Decarbonisation Perspective “zero” to reduce energy and process emissions to zero latest by 2060 (GtCO2) 43

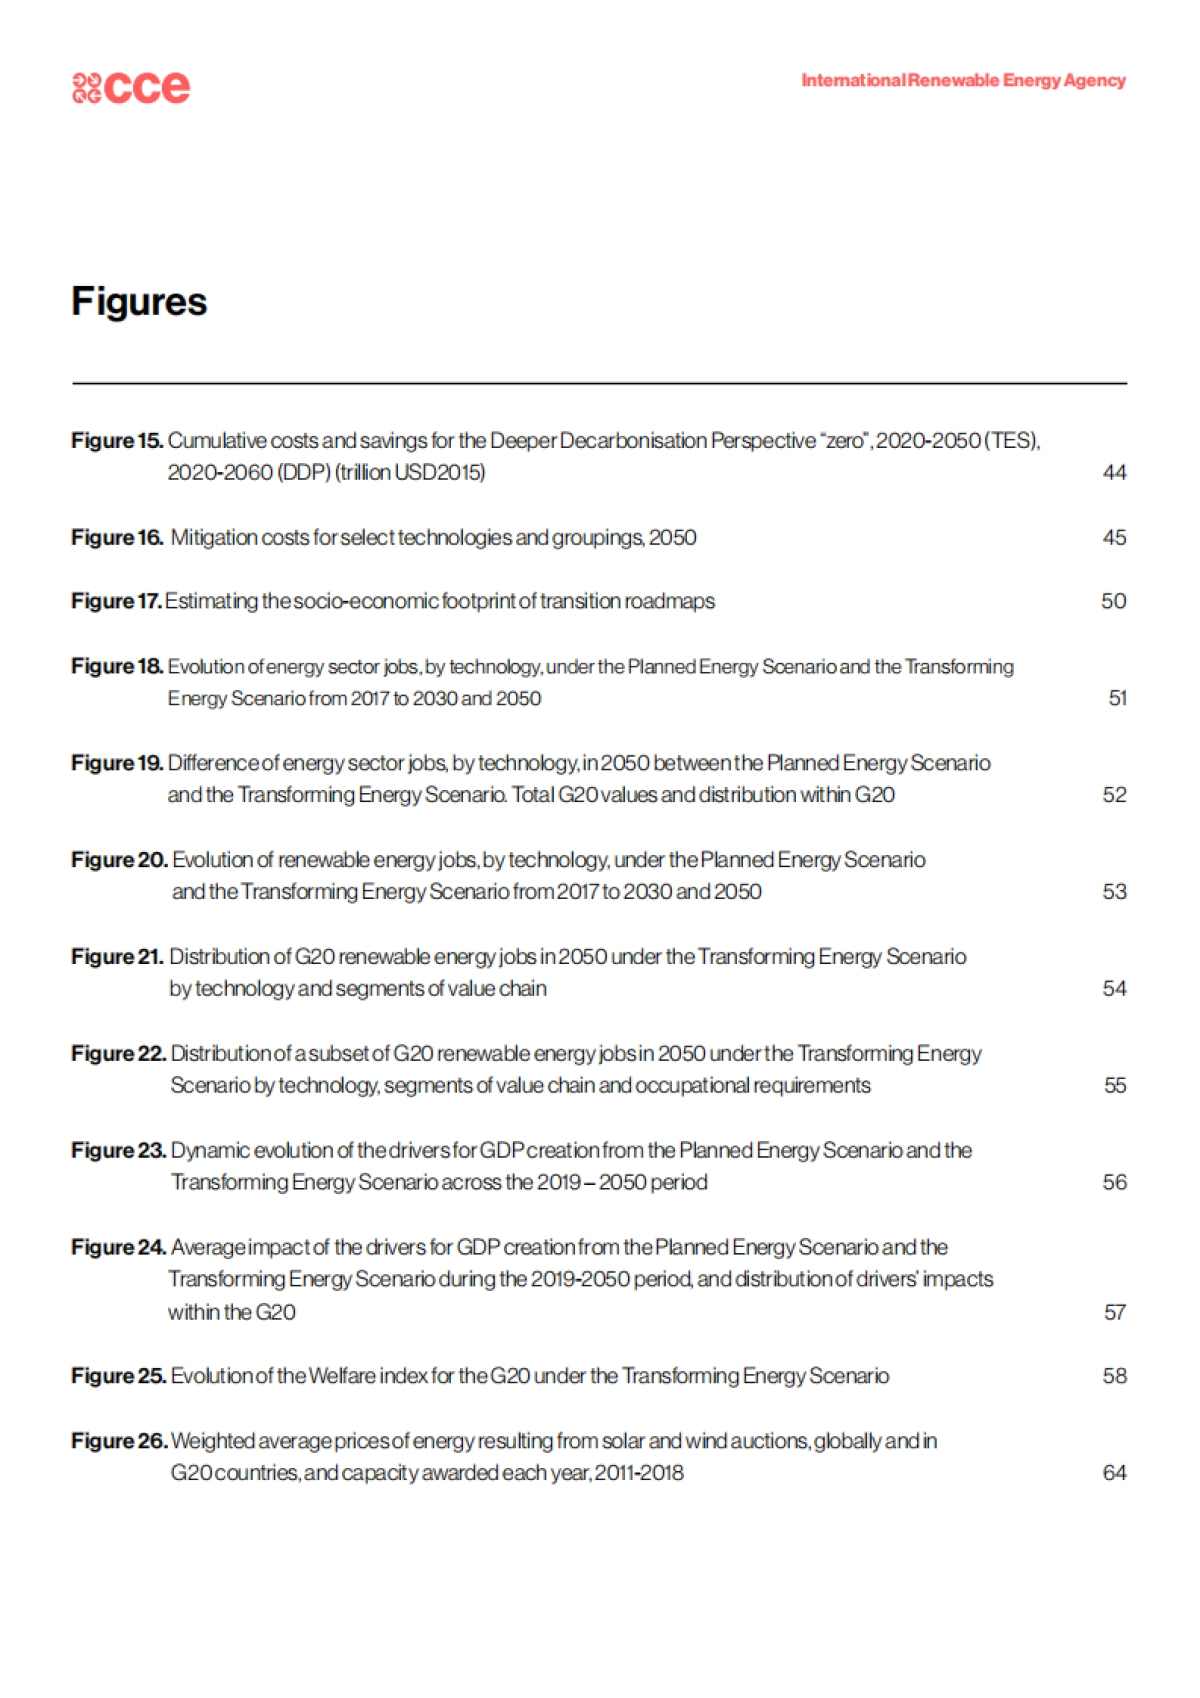
International Renewable Energy AgencyFigure 15. Cumulative costs and savings for the Deeper Decarbonisation Perspective “zero”, 2020-2050 (TES), 2020-2060 (DDP) (trillion USD2015) 44Figure 16. Mitigation costs for select technologies and groupings, 2050 45Figure 17. Estimating the socio-economic footprint of transition roadmaps 50Figure 18. ...

1、当您付费下载文档后,您只拥有了使用权限,并不意味着购买了版权,文档只能用于自身使用,不得用于其他商业用途(如 [转卖]进行直接盈利或[编辑后售卖]进行间接盈利)。
2、本站所有内容均由合作方或网友上传,本站不对文档的完整性、权威性及其观点立场正确性做任何保证或承诺!文档内容仅供研究参考,付费前请自行鉴别。
3、如文档内容存在违规,或者侵犯商业秘密、侵犯著作权等,请点击“违规举报”。

查找下载文件的指引

一、电脑端

- Windows 系统:按下键盘快捷键 `Ctrl + J`,即可打开下载列表。  

- Mac 系统:按下键盘快捷键 `⌘ + J`,即可打开下载列表。  

二、手机端

1. 打开手机浏览器,点击浏览器右下角的 “≡”(或“更多”)图标。  

2. 在弹出的菜单中找到并点击 “下载内容”(或类似选项),即可查看已下载的文件。  

提示:不同浏览器界面略有差异,若未找到“下载”入口,可尝试在浏览器设置中搜索“下载”关键词。

IREA-减少:非生物可再生能源(英文)

确认删除?
会员
教程
收藏
足迹
联系
  • 站长微信
回到顶部